
How to build an urban tree canopy plan with AI: baseline, plantable space and priority zones
Most cities now have a canopy goal: 30 percent by 2035, 40 percent by 2050, a tree within sight of every home. Far fewer have a plan that says where those trees should go, which blocks need them most, what they will cost to plant and keep alive, and what they will give back.
Building that plan has traditionally meant a consultant, a canopy study, several months and a large budget. NeuraCities Urban Forestry runs the same analysis from a study area boundary: it measures the canopy you have, finds the ground where new trees can realistically go, and ranks planting zones by where trees will do the most good.
Why canopy plans stall
Urban forestry teams usually know the broad picture: canopy is thin in older industrial areas and dense in wealthier neighborhoods, hot spots follow parking lots and wide arterials, and the same blocks that lack trees often score high on social vulnerability. The hard part is turning that picture into a list of places a crew can actually plant.
That requires combining very different data: a canopy layer, building footprints, road widths, utility lines, parcels and public ownership, a heat surface, a vulnerability index, and costs. Each comes from a different agency, at a different resolution, and each has to be clipped, aligned and reconciled before a single planting site can be trusted. NeuraCities Urban Forestry automates that chain.
Step 1: choose the study area
An analysis starts with a place. You can pick a city or town anywhere in the United States or Canada, a neighborhood, a county, a state or province (analysed as a 20 square mile sample), a custom area drawn on the map, or a single address for a site-level check. You can also upload a boundary file (GeoJSON, KML, shapefile or GeoPackage).
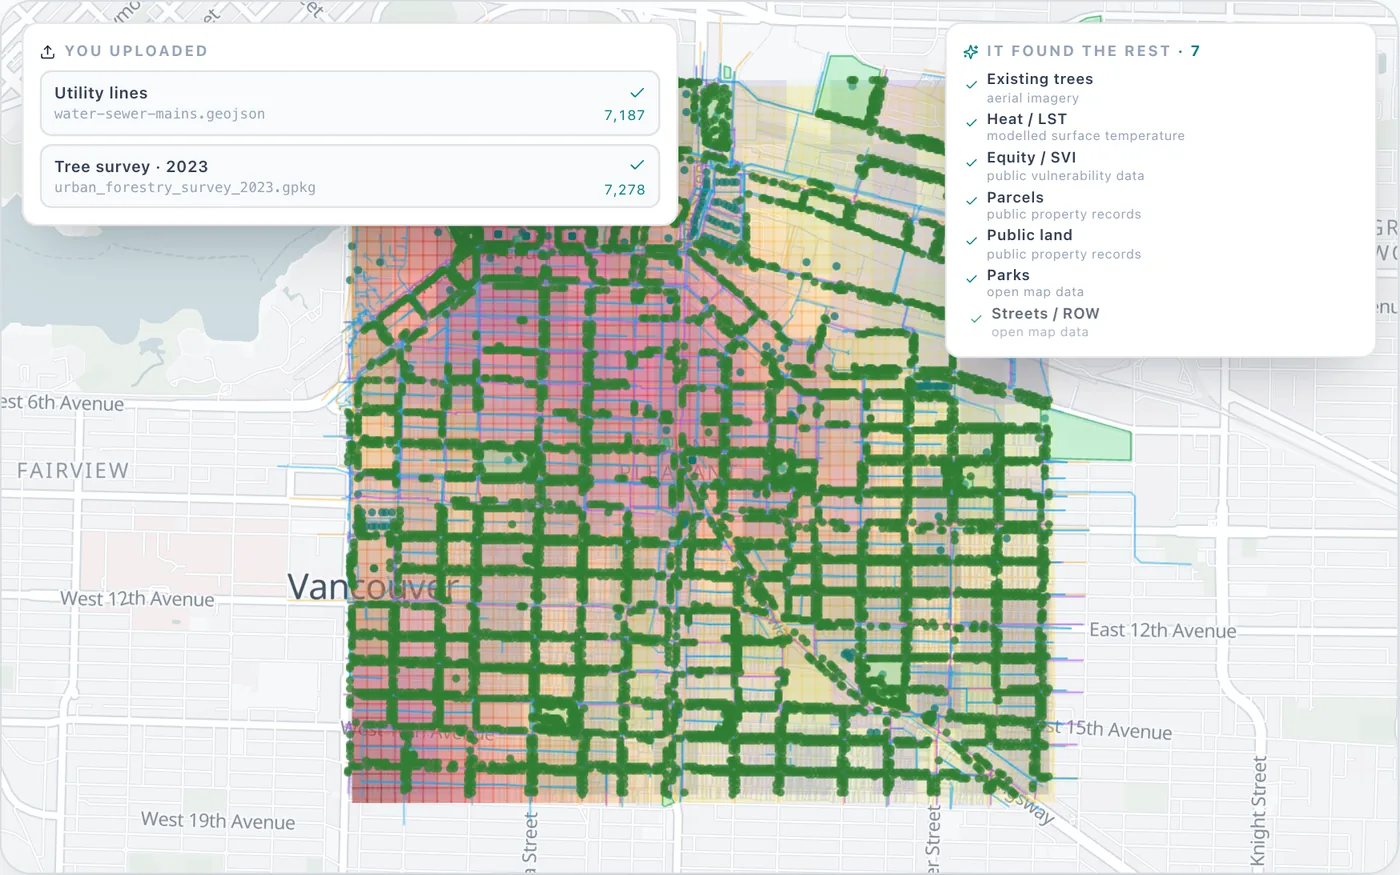
Optionally, add your own data. Typed upload slots cover the layers that matter most to a planting plan, and anything you provide is used in place of the public equivalent:
| Group | Layers you can supply |
|---|---|
| Planting drivers | Utility lines, public or city-owned land, parcels, existing tree inventory |
| Land cover and terrain | Impervious surface, elevation (DEM), heat or land surface temperature |
| Zoning and context | Zoning or land use, parks, equity or vulnerability layer |
| Boundaries | Neighborhoods, sub-city boundaries, parking lots |
| Point cloud | LiDAR in LAS or LAZ, converted to a canopy height model |
Step 2: measure the canopy you have
The canopy baseline is the foundation of everything else, so NeuraCities uses the most detailed source available for the study area, in this order:
- 1Your own canopy layer or LiDAR, if you uploaded one.
- 2USGS 3DEP airborne LiDAR, found automatically. A canopy height model (surface height minus ground height) is built, and vegetation taller than 2 m counts as canopy.
- 3NAIP 1 m aerial imagery (United States), classified with a vegetation index and cleaned up to remove noise.
- 4Sentinel-2 satellite imagery at 10 m.
- 5ESA WorldCover at 10 m, then the National Land Cover Database at 30 m as the fallback of last resort.
Alongside canopy, the baseline produces a land cover breakdown (tree canopy, grass and low vegetation, bare soil, water and impervious surface), which also sets the realistic ceiling on how much canopy the area could hold.
Existing trees are also detected individually. A tree detection model trained on aerial imagery locates tree crowns in the 1 m imagery, and new planting sites are kept clear of them.
Step 3: find the ground where trees can actually go
"Plantable" is where many canopy studies are too generous. A patch of grass is not a planting site if it sits over a gas main, under a power line or on a 25 degree slope. NeuraCities treats land as plantable only if it clears every one of these tests:
- Not already canopy, with a small buffer around existing crowns.
- Not impervious: road carriageways (sized by road class), building footprints from OpenStreetMap and Microsoft, parking and paved commercial or industrial land.
- Not water.
- Not too steep: slopes of 15 degrees or more are excluded.
- Clear of utilities: 5 m from overhead power lines, 3 m from gas, water and sewer, 2 m from telecom and 4 m from other underground lines.
- Clear of existing trees.
- Big enough to matter: fragments under 500 m² are dropped.
Street trees are handled separately, because that is how they are planted. Candidate positions are placed along each street, set back into the verge, with spacing by road class: about 12 m on major arterials down to 8 m on pedestrian streets. Motorways, ramps and service roads get none.
Show the data
| Overhead power | 5 m |
| Other underground | 4 m |
| Gas, water, sewer | 3 m |
| Telecom | 2 m |
Show the data
| Trunk and primary | 12 m |
| Secondary | 11 m |
| Tertiary | 10 m |
| Residential | 9 m |
| Pedestrian and living streets | 8 m |
Every plantable area is also tagged by ownership: public right-of-way, public parks, other city, county or public land, and private parcels, using the USGS Protected Areas Database, local parcel data and your uploads. You can restrict the plan to public land and street right-of-way, which is where most municipal programmes plant.
Step 4: rank where trees will do the most good
A plantable site in a cool, leafy, low-vulnerability neighborhood is still a plantable site, but it should not be first in line. NeuraCities scores the whole study area on three needs:
| Need | Data | Weight |
|---|---|---|
| Heat | Summer land surface temperature from Landsat 8 and 9 (30 m), with MODIS as a fallback | 35% |
| Equity | CDC Social Vulnerability Index, by census tract | 35% |
| Stormwater | Impervious surface share as a runoff proxy | 30% |
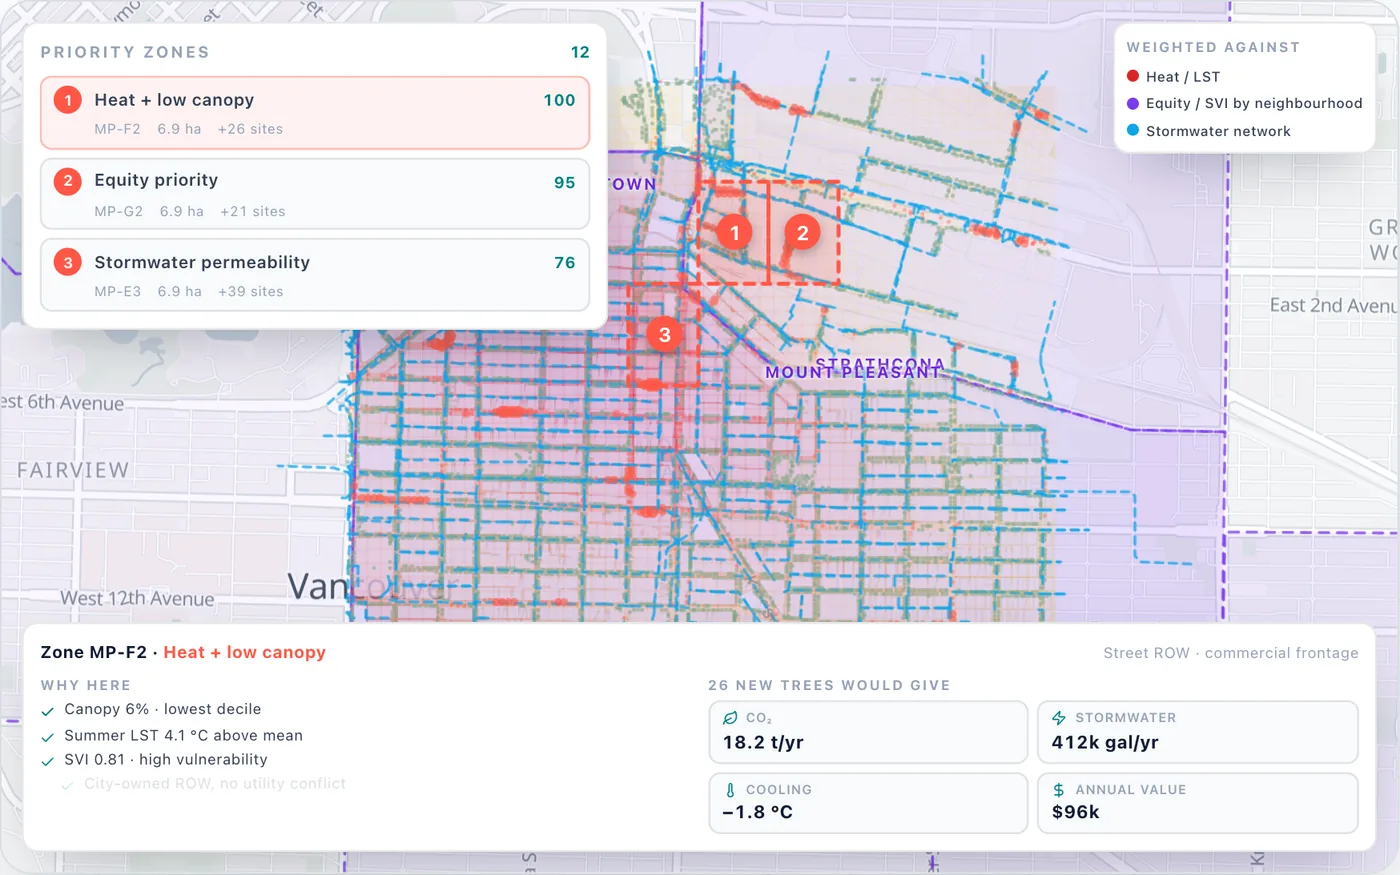
Areas with both high need and real plantable space are clustered into priority zones. Each zone comes with its rank, score, area, estimated number of trees, land use, and its primary driver: whether it is on the list mainly because of heat, equity or stormwater. That last field matters in practice, because it tells you which story to tell when you take the zone to a council or a funder.
Step 5: benefits, costs and phasing
For each priority zone, NeuraCities estimates what planting would deliver each year and over 20 years:
- Carbon sequestered, valued at the social cost of carbon.
- Stormwater intercepted, in gallons and dollars.
- Energy saved from shading.
- Air pollutants removed (ozone, nitrogen dioxide, sulphur dioxide, carbon monoxide and particulates).
- Local cooling, as the expected temperature reduction from the added canopy.
- Total annual value and a 20-year net present value.
Benefit rates are per-tree reference values drawn from i-Tree research, which makes them right for comparing zones and sizing a programme, and not a substitute for a species-specific i-Tree Eco study.
Costs follow a 20-year lifecycle rather than just the planting bill: planting, establishment watering, routine maintenance, sidewalk repair, removal, and replacement of trees that do not survive (street tree survival is modelled at 65%), plus programme overhead. Unit costs are national averages, so the budget is a sound starting point that you would refine with local contract prices.
Zones are then phased: equity-priority areas first, then the highest return on investment, then the rest. Each zone also shows the share of its cost that is typically grant-eligible, which is the number most funding applications ask for.
Step 6: species and site screening
- Species palette: a shortlist of 8 to 12 species suited to the area's USDA hardiness zone and planting context, following the common diversity guideline of no more than 10% of plantings from any one genus.
- Infrastructure conflicts: planting zones near utilities are flagged by severity, with gas, water and sewer lines rated highest.
- Environmental screening: zones are checked against FEMA flood zones, mapped wetlands, contaminated sites and soil survey data, so problem sites surface before a crew is sent out.
What the results look like
Results arrive as a scrolling, map-driven report, organised the way a canopy plan is usually read:
- 1Canopy today, with the land cover breakdown.
- 2Canopy health, where the imagery supports it.
- 3Heat and equity.
- 4Planting opportunity.
- 5Priority zones.
- 6Carbon and climate.
- 7Ecosystem benefits for the top zones.
- 8A 20-year phased budget.
- 9Species palette.
- 10Infrastructure conflict screening.
- 11Change over time, where earlier imagery is available.
- 12Methodology and data sources.
A layer explorer lets you switch between canopy, heat, equity, plantable area, candidate tree sites and priority zones on one map, and an Ask NeuraCities panel lets you question the results in plain English, such as "which zones are mostly public right-of-way?" or "how many trees would the top five zones add?".
Where it works
Urban Forestry is strongest for US cities and neighborhoods, where 1 m NAIP imagery, 3DEP LiDAR, the Social Vulnerability Index and national land cover data are all available. It also runs in Canada, with canopy from Sentinel-2 and WorldCover and province-aware boundaries; there, the equity overlay depends on a vulnerability layer you supply, since the CDC index covers the US only. Larger areas such as counties are supported and are split into tiles for processing.
Every account's first analysis, up to 20 square miles, is free.
Who uses it
- City urban forestry and parks departments preparing or updating an urban forest master plan.
- Sustainability and climate teams turning a canopy target into sites and budgets.
- Public works and stormwater teams looking for green infrastructure that reduces runoff.
- Nonprofits and tree planting organizations deciding where volunteer plantings will matter most.
- Consultants who want a fast, defensible first pass before detailed fieldwork.
See the product and an example run on the Urban Forestry page.
Frequently asked questions
How do you measure urban tree canopy cover?
From imagery or LiDAR. NeuraCities uses the best source available for the area: airborne LiDAR canopy height where it exists, otherwise 1 m NAIP aerial imagery in the US, then Sentinel-2, ESA WorldCover or NLCD. The canopy layer is clipped to the study area and summarised with a full land cover breakdown.
How does NeuraCities decide where trees can be planted?
Land counts as plantable only if it is not existing canopy, buildings, roads, paving or water, has a slope under 15 degrees, is clear of utility buffers and existing trees, and is at least 500 square metres. Street tree positions are placed along verges with spacing set by road class.
How are tree planting priority zones ranked?
By a composite of heat (Landsat land surface temperature, 35%), social vulnerability (CDC SVI, 35%) and stormwater need (impervious surface, 30%) across the plantable area. Each zone shows its primary driver, estimated trees, benefits and 20-year costs.
How accurate is AI tree canopy analysis?
In Portland, Oregon, NeuraCities measured 31.1% canopy against a commonly cited 29.8%. Accuracy depends on the imagery available, so results should be treated as planning-level estimates and confirmed with local field surveys.
Does NeuraCities Urban Forestry work in Canada?
Yes, with canopy from Sentinel-2 and ESA WorldCover. The US-specific datasets (NAIP, 3DEP LiDAR and the CDC Social Vulnerability Index) are not available there, so uploading local LiDAR or a vulnerability layer improves the results.
What does a canopy analysis cost?
Every account's first analysis, covering up to 20 square miles, is free.
See Urban Forestry run on a real neighborhood, then start your own study area.
Start a canopy analysis