
What is NeuraCities? The AI GIS platform that runs the analysis, not just the chat
NeuraCities is a geographic intelligence platform for planners, engineers, developers, consultants and analysts. You describe what you need to know about a place in plain English. NeuraCities finds the right public data, loads your own files, runs the spatial analysis with real GIS tools and hands back a map, the numbers behind it and a clear written answer.
It is not a chatbot that guesses about geography, and it is not a traditional GIS desktop with an assistant bolted on. It is a working GIS where an AI agent does the data collection and the analysis steps, and every step, source and layer stays visible so you can check the work.
The problem NeuraCities solves
Most spatial questions are simple to say and slow to answer. "Which parcels near a substation are outside the floodplain?" is one sentence. Answering it the traditional way means finding a parcel layer, a substation layer and a flood hazard layer, downloading each one, fixing projections, clipping everything to the study area, running a buffer, a spatial join and an overlay, then styling a map and writing up the result.
That work usually happens across five or more tools: a GIS desktop application, spreadsheets, a web browser full of open data portals, Google Maps and often a Python notebook. The analysis itself might take twenty minutes. Finding and cleaning the data can take days, and the knowledge of how it was done lives in one analyst's head.
NeuraCities collapses that into one place. The data search, the processing, the map, the chart and the written answer all happen inside a single conversation, and the conversation itself becomes the record of how the answer was produced.
What you can ask it
Anything that has a "where" in it. A few real examples of the kind of questions teams run:
- "Find parcels in Houston within 1,500 m of a substation and 500 m of a fiber line." (a data center siting screen)
- "Which commercial zones in Salt Lake City fall inside the FEMA 100-year floodplain?"
- "Map every building permit issued in Boston in 2023 and show where activity is concentrated."
- "Which census tracts in San Francisco have the highest affordable housing need?"
- "How many Charlotte bus stops have no shelter, broken down by council district?"
- "Where in Phoenix do residents live more than a ten minute walk from a park?"
You can be as precise or as loose as you like. A precise question ("within 500 m") is run exactly as written. A looser one ("good sites for a grocery store") gets a checklist first: NeuraCities states which criteria it will use and which data it needs, so you can see its interpretation before any results come back.
What happens after you press enter
Behind the chat box is a small team of specialised agents coordinated by an orchestrator. Each one has a narrow job and a fixed set of tools.
| Agent | What it does |
|---|---|
| Orchestrator | Reads the question, declares a checklist of what the answer needs, and hands work to the other agents in order. |
| Data Agent | Searches a registry of 600+ open data portals (ArcGIS Hub, Socrata, CKAN, OpenDataSoft and more), national catalogs such as data.gov and open.canada.ca, US Census ACS, OpenStreetMap and federal sources, then checks each candidate before downloading it. |
| GIS agent | Runs the spatial analysis using a library of deterministic operations: buffers, clips, overlays, spatial joins, dissolves, hot spot analysis, weighted overlay, network routing, terrain and raster analysis. |
| Cartography agent | Styles each layer with a sensible color scheme, graduated or categorical classes, and 3D extrusion when height matters. |
| Chart agent | Builds bar, line, pie, scatter and histogram charts from the analysed data. |
| Drive and database agent | Reads from your connected PostgreSQL database, Google Drive or OneDrive. |
The important design choice: the language model plans, the GIS engine calculates. The model decides that a 3 mile buffer is needed. A GIS library draws the buffer. Areas, distances, counts and statistics come from tested geospatial code (GeoPandas, Shapely, rasterio, OSMnx, scikit-learn and PySheds), never from the model estimating a number. That is what makes the output usable in real work.
For the full walkthrough of this pipeline, read How NeuraCities turns a plain-English question into a real GIS analysis.
What you get back
Every answer is a set of working artifacts, not just a paragraph:
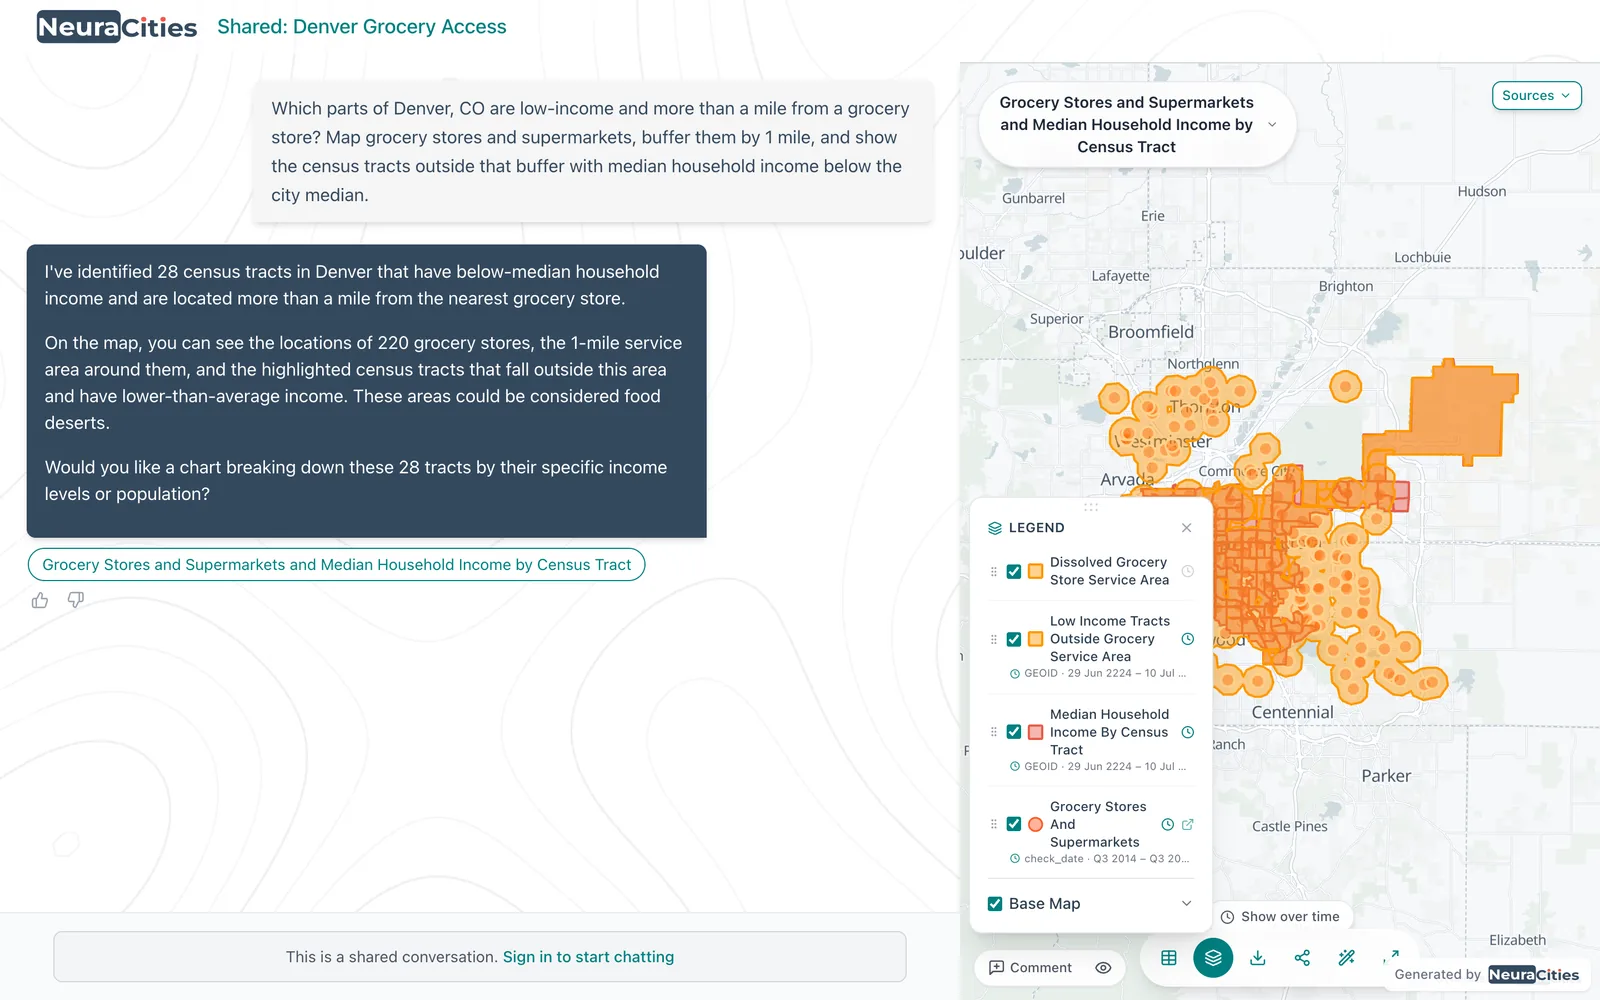
- An interactive map with each dataset as its own layer, a legend, light, dark, satellite, 3D and Google basemaps, Street View, and a time slider when the data has dates.
- Charts and tables built from the analysed data. Tables export to Excel and charts to PNG, PDF or CSV.
- A written answer with the actual counts and findings, plus a list of the data sources used and the steps taken.
- Reports that can be edited in place and exported as PDF.
- Dashboards: one click turns a conversation into an editable, long-form page with the maps and charts embedded, which can be shared by link.
- Print-ready map layouts from the export canvas: multi-page decks in landscape or portrait, exported as PNG, JPG, SVG or PDF.
- GIS files of any layer, downloadable as Shapefile or CSV for use in ArcGIS, QGIS or anything else.
Working with your own data
Public data only gets you so far. Most real projects combine it with something private: a client's parcel list, a utility's asset inventory, a survey spreadsheet or a stack of PDFs.
- Uploads: shapefiles, GeoJSON, CSV and Excel, GeoTIFF rasters, File Geodatabases, PDFs, Word documents and images. Spreadsheets with addresses can be geocoded, and tables can be joined to boundaries by a shared key.
- My Database: every file you upload is saved to your own persistent database, so you can reuse it in any future conversation without uploading it again. On Pro, a team can share one database.
- Connectors: connect a PostgreSQL database and NeuraCities can run read-only queries against it live, in every message. Google Drive and OneDrive connectors let you pull files straight from your cloud storage.
More detail in Your data and your team in NeuraCities.
When you want to do it yourself: GIS Studio
Sometimes you know exactly which operation you want and would rather click than type. GIS Studio is a manual workspace inside NeuraCities with a catalog of around fifty operations: buffer and multi-ring buffer, clip, intersect, union, difference, dissolve, spatial joins, hex and point grids, kernel density, hot spot analysis, DBSCAN and k-means clustering, Voronoi polygons, IDW interpolation, weighted overlay, Moran's I, raster zonal statistics, slope, hillshade, reclassification, viewshed, network service areas and shortest paths.
Lighter operations run directly in your browser without using any of your plan's usage. Heavier ones run on the NeuraCities backend. You can switch between asking and clicking on the same data at any point.
How you can trust the result
The fair criticism of AI in GIS is that it can produce a confident map from the wrong data. NeuraCities is built to make that visible instead of hiding it:
- Every layer keeps its source: the publisher, the dataset and the link it came from. Derived layers point back to the source they were built from.
- Every step is listed in the conversation as it runs: which datasets were found, which were loaded, which GIS operation ran on what.
- Requirements are checked. The checklist declared at the start is compared against what was actually delivered, and anything missing is stated in the answer rather than quietly dropped.
- You can inspect any layer: its columns, summary statistics and rows, directly on the map.
- Every operation is logged on the backend, which is how we audit and improve the agents.
Like any analysis, results are only as good as the underlying data. Open data portals vary in how current and complete they are, which is exactly why NeuraCities shows you the source and date of each layer rather than blending them into an unexplained answer.
Sharing and collaboration
Spatial work is rarely for the person who made it. NeuraCities is built for handing results to people who do not use GIS:
- Share links to a conversation. Recipients open the same maps, charts and answer in their browser and can explore the map themselves.
- Invite by email, with a roster of who has access.
- Comment pins that anchor to an exact spot on a map (in 2D and 3D), or to a passage in a report, with threads and resolve.
- Workflows: save a prompt as a reusable template with {{variables}} such as a city or a distance, and rerun it for the next project with new inputs.
The NeuraCities product family
The GIS platform described above is the core product. The same agent approach powers purpose-built applications for specific industries:
| Product | What it does |
|---|---|
| NeuraCities GIS | The general-purpose AI GIS platform: questions in, maps, analysis and reports out. |
| Urban Forestry | Tree canopy planning: measures existing canopy, finds plantable space, ranks priority planting zones by heat, equity and stormwater need, and estimates 20-year costs and benefits. |
| Stormwater Engineering | Flood and drainage workflows built on engineering models such as EPA SWMM, HEC-RAS and HEC-HMS, from existing conditions to prioritised mitigation options. |
| Digitization (As-Built) | Turns scanned drainage and utility drawings into georeferenced GIS features and model-ready networks. |
Plans and pricing
| Plan | Price | Best for |
|---|---|---|
| Free | $0, no card needed | Trying NeuraCities on real questions: starter usage, 5 GB of storage, 2 collaborators per conversation. |
| Pro | $50 per month, first month free | Professionals and small teams: 8x more usage than Free, refreshed every week, 15 GB storage, team database, shareable workflows and dashboards, no watermark, unlimited GIS downloads. |
| Max | Custom | Organizations: unlimited usage, collaborators and storage, custom connectors, custom deployment and security review, dedicated support. |
Current details are always on the pricing page.
How NeuraCities fits next to ArcGIS, QGIS and other tools
NeuraCities is not trying to replace every desktop GIS workflow. Cartographers producing a statewide map series, or teams running enterprise geodatabases, will keep using ArcGIS or QGIS for that work, and NeuraCities exports Shapefiles and CSVs so results move into those tools easily.
Where NeuraCities is different is the part of the job that comes before and after the analysis: finding data you did not already have, running the multi-step analysis from a description of the goal, and delivering something a non-GIS stakeholder can open and understand. We wrote a longer, even-handed comparison in AI GIS software in 2026: how to choose.
Frequently asked questions
What is NeuraCities?
NeuraCities is an AI-native geographic information system (GIS). You ask a spatial question in plain English, and its AI agents find relevant public and private data, run real GIS operations and return interactive maps, charts, tables and a written answer with sources.
Is NeuraCities available now?
Yes. Anyone can sign up with Google, Microsoft or email and start on the free plan without a credit card. Pro is $50 per month with the first month free, and Max is a custom plan for organizations.
Do I need GIS experience to use NeuraCities?
No. It is designed so planners, engineers and analysts without GIS training can run spatial analysis by describing what they need. GIS professionals use it to skip data hunting and repetitive processing, and can use GIS Studio for direct, manual control.
Where does NeuraCities get its data?
From government and institutional open data: a registry of over 600 open data portals (city, county, state, provincial and national), catalogs such as data.gov and open.canada.ca, the US Census Bureau, FEMA, USGS, NOAA, EPA, OpenStreetMap and more. You can also upload your own files or connect a PostgreSQL database, Google Drive or OneDrive.
Which areas does NeuraCities cover?
It works anywhere open data exists, and it is strongest in the United States and Canada, where the depth of city, county, state and federal open data is greatest.
Does the AI make up the numbers?
No. The language model plans the analysis and chooses operations. Measurements, counts and statistics are computed by deterministic GIS libraries on the actual data, and each layer keeps its source so results can be checked.
Can I export results to ArcGIS or QGIS?
Yes. Map layers can be downloaded as Shapefile or CSV, and maps and layouts export as PNG, JPG, SVG or PDF.
Who is behind NeuraCities?
NeuraCities was co-founded by Krish Mehta and Satish Kamath. The company is based in Katy, Texas, with offices in Surrey, British Columbia and Fremont, California, and is part of Google for Startups.
Ask your first question in plain English. No GIS software to install.
Start mapping free