
How NeuraCities turns a plain-English question into a real GIS analysis
A lot of "AI for maps" products stop at the chat window: a language model reads your question and writes a plausible answer. That is fine for trivia. It is not fine when the answer goes into a council memo, a site selection report or an engineering study.
NeuraCities was designed around one principle: the language model is the planner, the GIS engine is the calculator. This article walks through exactly what happens between the moment you ask a question and the moment a map comes back.
The core idea: LLMs plan, GIS code calculates
Large language models are very good at understanding what someone means by "underserved neighborhoods" or "sites near good transit". They are not reliable at computing the area of a polygon, counting points inside a floodplain or measuring a network distance. Those jobs have had correct, tested solutions in GIS software for decades.
So NeuraCities splits the work. The model interprets the question, picks datasets and chooses operations. The operations themselves are ordinary geospatial code with fixed, inspectable behaviour. When the answer says "34 parcels", that number was produced by a spatial filter on real parcel geometry, not by a model generating text.
The model decides a 1,500 m buffer around substations is needed. A GIS library draws the buffer. That separation is the difference between a demo and a tool you can put your name on.
Step 1: the orchestrator declares a checklist
Every analytical question starts with the orchestrator writing down what a complete answer requires. For "Which parcels in Houston are within 1,500 m of a substation and 500 m of fiber?" that checklist looks roughly like this:
- 1Parcel boundaries for Houston (Harris County).
- 2Electrical substation locations.
- 3Fiber optic line locations.
- 4A 1,500 m buffer around substations and a 500 m buffer around fiber.
- 5Parcels that fall inside both buffers, with a count and a map.
This does two useful things. It shows you the interpretation up front, so a misread question is obvious in seconds rather than after the analysis. And it becomes the yardstick at the end: the finished answer is checked against it item by item.
Step 2: the Data Agent finds and verifies the data
Finding the right dataset is the slowest part of most GIS projects, and it is where NeuraCities does most of its work. The Data Agent has several ways to look:
| Source | What it covers |
|---|---|
| Portal registry | 600+ registered open data portals: about 190 in the United States, 140 in Canada and many more worldwide, across ArcGIS, CKAN, Socrata, OpenDataSoft, DKAN, WFS and other platforms. |
| Live catalog search | ArcGIS Hub and the Socrata Discovery API, plus national CKAN catalogs: data.gov, open.canada.ca, data.gov.uk, data.gov.au and data.govt.nz. |
| US Census | American Community Survey 5-year estimates and TIGER boundaries for demographic, income, housing and commuting questions. |
| Federal sources | FEMA flood hazard data, USGS elevation (3DEP), the National Land Cover Database, NOAA, EPA, HIFLD infrastructure, NREL, USDA soils and more. |
| OpenStreetMap | Roads, buildings, amenities, land use and physical features anywhere in the world. |
| Places and addresses | Business and point-of-interest search, plus geocoding of address lists. |
| The open web | Web search and page reading for datasets and facts that are published outside a portal, such as a PDF table of statistics. |
Show the data
| ArcGIS | 276 |
| CKAN | 193 |
| Socrata | 60 |
| Other REST APIs | 36 |
| OpenDataSoft | 24 |
| Other | 23 |
Crucially, finding a promising dataset is not the same as using it. Before downloading, the agent probes each candidate: how many features it has inside the study area, which fields it carries and whether the geometry makes sense. A county-wide parcel layer that turns out to have zero features inside the city limits is caught here, not after it has quietly produced an empty map.
It can also merge sources. A question that spans several cities can pull the same kind of layer from each jurisdiction and combine them, removing duplicates where they overlap. Tables without geometry, such as a spreadsheet of statistics by neighborhood, can be joined to boundaries on a shared key.
Step 3: the GIS agent runs deterministic operations
Once the layers are loaded, the orchestrator describes the analysis task in plain language and the GIS agent translates it into a sequence of operations from a fixed library. A selection of what is available:
| Category | Operations |
|---|---|
| Vector basics | Filter, buffer (single, multi-ring and variable distance), clip, intersect, union, difference, dissolve, reproject, simplify, centroid, convex hull, area and length, calculated fields, geometry repair. |
| Joins | Spatial join, nearest-feature join, attribute join, area-weighted join (for apportioning census data to other boundaries), k-nearest neighbours, within-distance. |
| Suitability | Weighted overlay for multi-criteria site scoring, aggregation by zoning, hex and point grids. |
| Spatial statistics | Hot spot analysis, global and local Moran's I, geographically weighted regression, bivariate analysis, trend analysis, kernel density, IDW interpolation, DBSCAN and k-means clustering. |
| Networks | Shortest paths, multi-stop routes, network service areas, nearest facilities along the street network, network connectivity. |
| Raster and terrain | Slope, aspect, hillshade, viewshed, cost distance, terrain ruggedness, zonal statistics, raster calculator, reclassify, polygonize, NDVI and NDWI, change detection. |
| Hydrology | Watershed delineation, flow accumulation, SCS curve number runoff, stormwater volume, impervious surface and flood risk scoring. |
These run on the standard open-source geospatial stack: GeoPandas and Shapely for vectors, rasterio for rasters, OSMnx for street networks, scikit-learn for clustering and PySheds for hydrology. Projections are handled explicitly, so distances and areas are measured in a suitable projected coordinate system rather than in degrees.
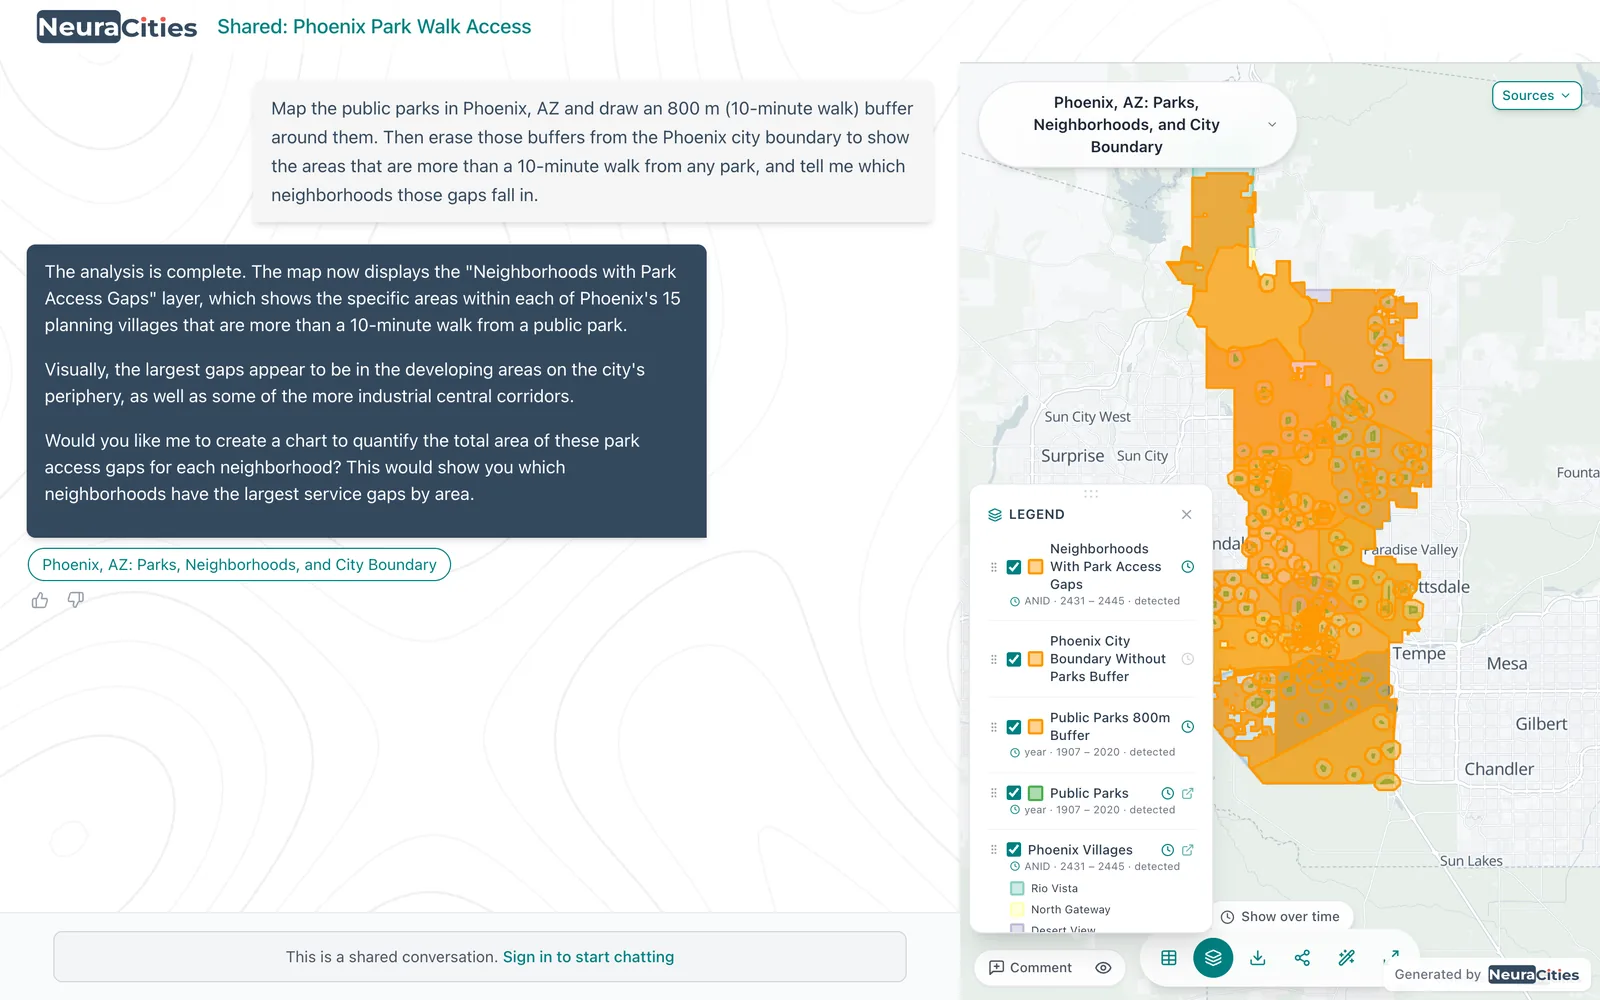
After each step the agent can inspect the result: column names, summary statistics and sample rows. That is how it notices, for example, that a zoning field uses codes rather than names, and adjusts the next filter to match.
Step 4: styling, charts and the written answer
Raw layers are not a deliverable. Two more agents turn them into something a reader can use:
- The cartography agent chooses a theme that fits the subject (water and flood, heat, green space, civic, equity and others), picks graduated or categorical classes based on the actual values, and extrudes features in 3D when height or intensity is the point.
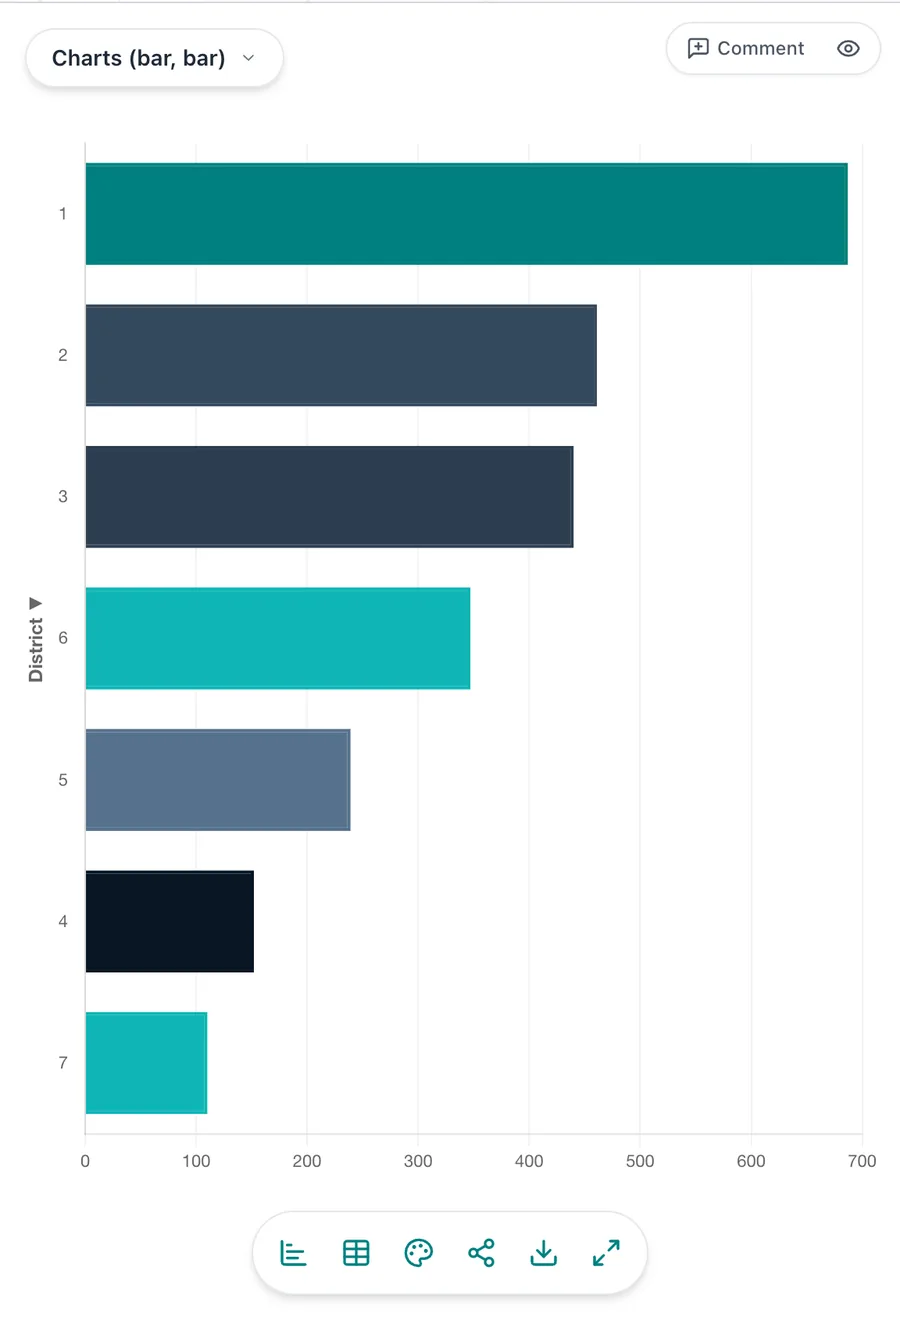
- The chart agent builds bar, column, line, pie, scatter or histogram charts from the analysed attributes, such as counts by district or distributions of distance.
The orchestrator then writes the answer: what was found, the key numbers, how they were produced and which sources were used. You can ask for a longer written report, or turn the whole conversation into a dashboard page with the maps and charts embedded.
Step 5: checking the work against the checklist
Before the answer is final, the declared checklist is compared with what was actually delivered. If a requirement could not be met (say, no public fiber data exists for a particular county), the answer says so plainly and suggests what could fill the gap, such as uploading a utility's own layer. Work that was still in progress when a turn ended is saved and picked up in the next message.
This is a deliberate trade-off. It is easy to make an AI system look impressive by always returning something. It is more useful to return exactly what the data supports and be clear about the rest.
What you can see while it runs
Every stage streams into the conversation in real time, so you are never waiting on a black box:
- The checklist, as soon as it is declared.
- Each dataset found, and each one loaded onto the map as it arrives.
- Each GIS operation as it starts and completes.
- How much of your plan's usage the request used.
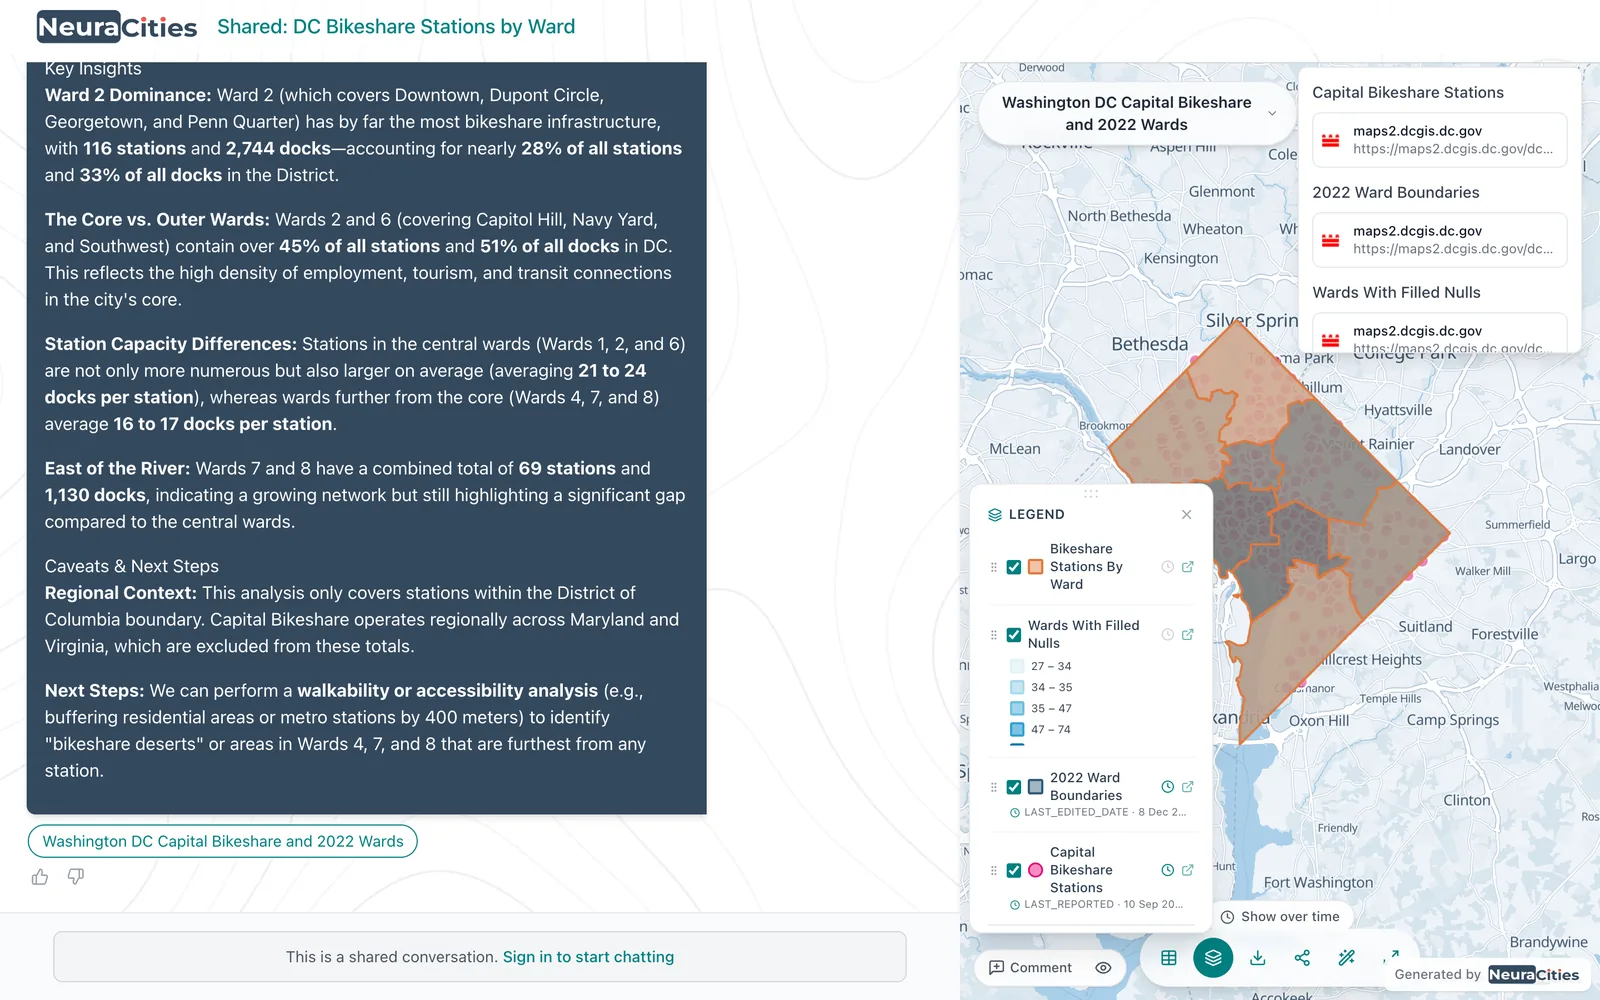
After the fact, each layer's source (publisher, dataset and link) stays attached to it, and derived layers point back to the data they were built from. Sources in generated dashboards are read from that record, not written by the model, so a citation can never be invented.
Which AI models it uses
NeuraCities uses multiple model providers and assigns each agent the model that suits its job. The orchestrator, Data Agent and GIS agent run on Google Gemini models, lighter tasks such as map styling use smaller and faster models, and if a primary model is unavailable, requests fall back to Anthropic's Claude. Because the heavy lifting is done by GIS code rather than by the model, swapping models does not change how an area or a count is calculated.
Honest limits
No GIS, AI-driven or not, is better than its inputs. A few things worth knowing:
- Open data varies. Some cities publish current, complete parcel and zoning layers; others publish little. NeuraCities shows each layer's source so you can judge it, and you can always upload a better one.
- Network service areas are approximations. Walk and drive areas are computed on the OpenStreetMap street network by network distance, which is well suited to planning screens but is not a substitute for a calibrated traffic model.
- Coverage is deepest in the US and Canada. The platform works anywhere open data exists, but US and Canadian portals and federal sources are the most thoroughly integrated.
- Complex questions take a few minutes. A multi-city, multi-dataset analysis involves real downloads and real processing, and progress is shown throughout.
Frequently asked questions
Is NeuraCities just ChatGPT connected to a map?
No. The language model only plans and explains. Data discovery, verification, spatial analysis, styling and charting are handled by specialised agents calling deterministic tools, and the numbers come from GIS code running on real data.
How does NeuraCities find data for my city?
Its Data Agent searches a registry of over 600 open data portals and national catalogs such as data.gov and open.canada.ca, along with US Census, FEMA, USGS, OpenStreetMap and other sources. It probes each candidate for coverage and fields before downloading it.
What GIS operations can the NeuraCities agent run?
Buffers, overlays, spatial and attribute joins, area-weighted apportionment, weighted overlay suitability, hot spot and cluster analysis, Moran's I, geographically weighted regression, kernel density, interpolation, network routing and service areas, raster terrain analysis, change detection and hydrology tools such as watershed delineation.
Can I see where each dataset came from?
Yes. Every layer keeps its source name and link, derived layers reference their parent data, and the steps the agents took are listed in the conversation.
What happens if the data I need does not exist?
The answer says which requirement could not be met instead of silently leaving it out, and suggests alternatives such as a proxy dataset or uploading your own file.
Ask your first question in plain English. No GIS software to install.
Start mapping free