
AI site selection with GIS: a practical guide to finding and ranking sites
Site selection is one of the most common reasons people reach for GIS, and one of the most tedious. The criteria are usually clear (near power, outside the floodplain, enough people within a drive, the right zoning), but assembling the layers to test them can take a week before a single candidate appears on a map.
This guide shows how to run the same analysis in NeuraCities, from the first question to a ranked, sourced shortlist you can hand to a client or an investment committee.
Why site selection takes so long the traditional way
A typical screen for a new facility needs six to ten layers: parcels, zoning or land use, flood hazard, roads, utilities, competitors or existing facilities, and demographics. Each lives on a different portal, in a different format and projection. Parcel data alone can mean a county assessor download, a schema you have never seen and a field called something like LUC_CD that nobody documented.
Only after all of that does the actual analysis start, and the analysis is the easy part: a few buffers, an overlay, a join and a sort. NeuraCities moves the effort back where it belongs, onto deciding the criteria.
Step 1: write the criteria down
Good site selection starts with separating what is non-negotiable from what is merely preferred. For example, for a mid-size data center:
| Type | Criterion | Typical data |
|---|---|---|
| Hard constraint | Within 1,500 m of an electrical substation | Substations (HIFLD, utility or city open data) |
| Hard constraint | Within 500 m of a fiber optic line | Fiber routes (city or state open data, or your own layer) |
| Hard constraint | Outside the FEMA 100-year floodplain | FEMA National Flood Hazard Layer |
| Hard constraint | Parcel of at least 10 acres | County parcels |
| Soft criterion | Industrial or compatible zoning | City zoning |
| Soft criterion | Close to a highway | OpenStreetMap roads |
| Soft criterion | Lower land value | Assessor attributes on the parcel layer |
You do not need to fill in the data column yourself. That is what the Data Agent is for. But being explicit about which criteria are filters and which are preferences makes the result far easier to defend.
Step 2: ask the question
Type it the way you would brief a colleague. For example:
Find parcels in Houston of at least 10 acres that are within 1,500 m of a substation and 500 m of a fiber line, outside the FEMA 100-year floodplain. Rank them by zoning compatibility and distance to the nearest highway, and show the top 20.
NeuraCities responds with a checklist of the data and steps it will use before doing anything else. If it has read a criterion differently than you meant (for example, the 0.2% annual chance zone instead of the 1% zone), you can correct it right there.
Step 3: what the Data Agent pulls in
For a US site selection question, the Data Agent typically assembles:
- Parcels from the county or city open data portal, or from statewide parcel programs where they exist.
- Zoning and land use from the city's portal.
- Flood hazard zones from the FEMA National Flood Hazard Layer.
- Infrastructure such as substations and transmission lines from federal and local sources, and fiber routes where a city or state publishes them.
- Roads, rail and amenities from OpenStreetMap.
- Demographics such as population, income and households from the Census American Community Survey, by tract or block group.
- Competitors or existing facilities from business listings or open data.
Each dataset is probed for coverage in the study area before it is downloaded, and appears on the map as its own layer with its source attached. If a key layer does not exist publicly (fiber is often the gap), NeuraCities tells you, and you can upload your own.
Step 4: filter, score and rank
The GIS agent turns the criteria into a sequence of standard operations:
- 1Buffer substations by 1,500 m and fiber by 500 m.
- 2Keep parcels that intersect both buffers.
- 3Remove parcels that intersect the 1% annual chance flood zone.
- 4Filter by calculated parcel area.
- 5Join zoning to each remaining parcel and measure the distance to the nearest highway.
- 6Normalise each soft criterion and combine them in a weighted overlay using the weights you gave (or equal weights if you did not).
- 7Sort by score and return the top candidates.
Because each step is a deterministic GIS operation, the result is repeatable: run it again on the same data and you get the same parcels. Change a weight and only the ranking changes. In one real Houston run of this kind of screen, the combined power and fiber proximity rule narrowed Houston's parcels down to 34 candidates, a list short enough to review by hand.
Show the data
| Under 125 m | 11 |
| 125 to 250 m | 6 |
| 250 to 375 m | 6 |
| 375 to 500 m | 11 |
For demand-driven sites (retail, clinics, childcare), the analysis usually adds a catchment: population within a network service area around each candidate, computed on the street network and summed with an area-weighted join to the Census geography. That tells you how many people each site actually serves, not just how close it is to something.
Step 5: review the shortlist
The answer arrives as a working set of outputs:
- A map of the candidates, styled by score, over the constraint layers.
- A ranked table with parcel IDs, area, zoning, distances and score, exportable to Excel.
- Charts comparing the top sites on each criterion.
- A written summary with counts, the criteria as applied and the sources used.
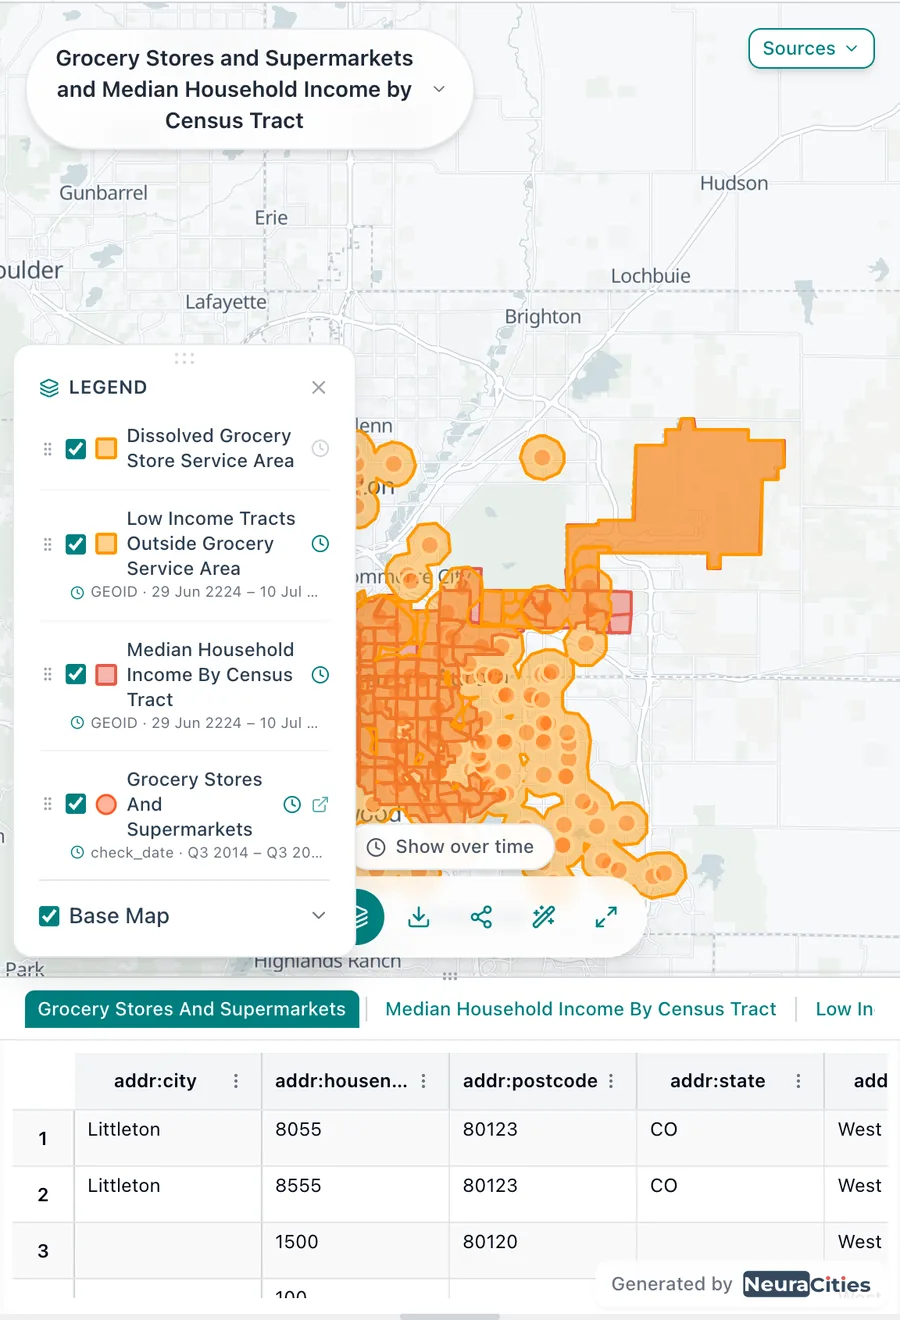
From here, keep asking. "Drop anything within 300 m of a school." "Show me the top five in 3D against the satellite basemap." "Which of these are owned by the same entity?" Each follow-up builds on the layers already loaded, so it is fast.
Step 7: make it repeatable with workflows
Most teams run the same screen many times: the same criteria for a different metro, or the same metro with a different acreage. Save the prompt as a workflow and replace the parts that change with variables:
Find parcels in {{city}} of at least {{min_acres}} acres within {{power_distance}} of a substation, outside the FEMA 100-year floodplain, ranked by distance to the nearest highway.
When you run the workflow, each {{variable}} becomes an input field, including a location picker for the city. The analysis is identical every time, which is exactly what you want when comparing markets.
Site selection questions teams run in NeuraCities
| Use case | Typical criteria |
|---|---|
| Data centers | Substation and transmission proximity, fiber, flood risk, parcel size, water availability |
| Solar and battery storage | Slope, land cover, transmission distance, protected areas, parcel size |
| Retail and restaurants | Population and income in a drive-time catchment, competitor locations, traffic corridors, zoning |
| Healthcare and clinics | Underserved population, distance to existing facilities, transit access |
| Affordable housing | Transit access, jobs, schools, flood risk, publicly owned land |
| EV charging | Traffic volumes, existing chargers, multifamily density, commercial parking |
| Warehouses and logistics | Highway access, industrial zoning, labor pool within a commute, flood risk |
Tips for a defensible analysis
- State distances and thresholds explicitly. "Near a highway" is a judgement; "within 2 km of an interstate on-ramp" is a criterion.
- Check the sources on the key layers. Open the layer details to see who published it and how current it is, especially parcels and zoning.
- Upload what you trust more. If your client has a better parcel file or a utility has shared its lines, upload it; your data takes priority.
- Keep the weights visible. Put them in the question so they are recorded in the conversation and anyone reviewing the result can see them.
- Treat it as a screen, then verify. A GIS screen narrows hundreds of parcels to a handful. Title, environmental and engineering due diligence on the finalists still matter.
Frequently asked questions
Can AI do site selection analysis?
Yes, when the AI plans the analysis and a GIS engine performs it. In NeuraCities you describe your criteria in plain English; the agents find the parcel, zoning, flood, infrastructure and demographic data, apply the criteria with standard GIS operations and return a ranked, mapped shortlist with sources.
What data does NeuraCities use for site selection?
Typically county parcels, city zoning, the FEMA National Flood Hazard Layer, infrastructure such as substations and transmission lines, OpenStreetMap roads and amenities, and US Census ACS demographics. You can also upload your own layers or connect a PostgreSQL database.
How are candidate sites ranked?
Hard constraints filter the candidates, then soft criteria are normalised and combined with a weighted overlay using the weights you specify. The weights are stated in the conversation so the ranking is transparent and easy to change.
Can I rerun the same site selection for another city?
Yes. Save the prompt as a workflow with variables such as {{city}} or {{min_acres}}, and run it again with new inputs. The analysis steps stay the same, which makes markets directly comparable.
Can I export the shortlist?
Yes. The candidate layer downloads as Shapefile or CSV, the ranked table exports to Excel, and maps and multi-page layouts export as PNG, JPG, SVG or PDF.
Describe your criteria and get a ranked, sourced shortlist on the map.
Run your first site screen