
Can ChatGPT do GIS? What chatbots get right about maps, and where they fail
"Can ChatGPT do GIS?" is one of the most common questions planners and analysts ask once they have used a chatbot for a few weeks. The honest answer is: some of it, very well, and some of it not at all. A general chatbot is an excellent GIS tutor and a fast code assistant. It is not, by itself, a GIS: it does not hold your city's parcel layer, and it cannot measure a polygon it has never seen.
This guide walks through both sides fairly, explains why the gap exists, and shows what changes when an AI is connected to real data and real geoprocessing instead of answering from memory.
The short answer
ChatGPT and similar assistants know a great deal about GIS. In a 2023 study, researchers gave GPT-3.5 and GPT-4 a real introductory GIS exam, and GPT-4 scored 88.3%, a B+, while GPT-3.5 scored 63.3%. The same paper also identified specific questions where the models struggled with spatial concepts. So the knowledge is there, and it is improving.
Knowing about GIS is different from doing GIS, though. An exam asks what a spatial join is. A planning question asks how many bus stops in Charlotte's District 1 have no shelter. The first is a language task. The second needs the transit agency's stop layer, the council district boundaries and a point-in-polygon operation, and no amount of reading prepares a model to produce that count from memory.
What ChatGPT is genuinely good at in GIS work
It would be unfair, and unhelpful, to pretend chatbots are useless for spatial work. Plenty of GIS professionals use them daily for:
- Explaining concepts. The difference between a geographic and a projected coordinate system, why a buffer in degrees is wrong, what a Moran's I value means, when to use a network service area instead of a straight-line buffer. A chatbot is patient and available at 11pm.
- Writing code. GeoPandas and Shapely scripts, ArcPy geoprocessing loops, PyQGIS snippets, PostGIS SQL, field calculator expressions and regular expressions for messy address fields. It is also good at reading a traceback and suggesting the fix.
- Drafting methods. Turning "find sites near transit outside the floodplain" into a step-by-step method you can check before you start.
- Reading documents. Summarising a zoning ordinance, pulling the setback and height rules for a district into a table, or comparing two versions of a comprehensive plan chapter.
- Working with files you upload. ChatGPT's data analysis feature runs Python on uploaded spreadsheets and other files, which handles a lot of tabular cleanup.
Where general chatbots fall short
No authoritative layers by default
A chatbot's knowledge comes from text it was trained on, plus whatever a web search returns. Neither is a parcel file. Web search finds pages about data; it does not download a city's zoning layer, check that it covers the study area and load its geometry. When a chatbot answers a question like "which commercial zones are in the floodplain" without those layers, it is describing what the answer probably looks like.
Plausible coordinates and counts that are not real
Ask for the coordinates of a landmark or the number of schools in a district and you will usually get a confident, specific answer. Specific is not the same as correct. A 2025 study testing GPT-4o and Gemini 2.0 Flash on geocoding, elevation and reverse geocoding concluded that while LLMs can approximate geographic information, their accuracy and reliability are inconsistent. Counts are worse than coordinates: there is no way to know how many features are in a layer without the layer.
Spatial reasoning is uneven
Multi-step spatial tasks remain hard for language models working alone. In a 2025 multi-task benchmark of LLMs on spatial tasks, GPT-4o reached only 12.4% on simple route planning without prompting help, rising to 87.5% with chain-of-thought prompting. Good prompting helps a lot, which is a theme of our guide to prompting AI for GIS, but the variance is the point: you cannot tell from the answer alone which kind of run you got.
GIS file formats are awkward
A shapefile is not one file. It is a .shp with its .dbf, .shx and usually a .prj, and missing the .prj means the coordinates have no defined projection. Whether a general chatbot can open a shapefile, a File Geodatabase or a large GeoTIFF depends on the libraries in its sandbox and on you zipping the parts correctly, and when it cannot, it may still describe the file as if it had.
The same question, a different answer
Language models sample their output. OpenAI's own documentation describes its chat models as non-deterministic by default, and even with a fixed seed, determinism is best effort rather than guaranteed. That is fine for drafting a memo. It is a problem for a number that has to match when a reviewer reruns it.
Maps drawn as pictures
Image-generating chatbots can produce something that looks like a thematic map. Cartographers have started to catalogue the information distortion in AI-generated thematic maps, because a picture of a map has no underlying features to check: no attribute table, no legend tied to data, no source.
Chatbot versus AI GIS tool, task by task
| Task | General chatbot | AI GIS tool such as NeuraCities |
|---|---|---|
| Explain a GIS concept | Excellent | Good, but not its main job |
| Write ArcPy, PyQGIS or PostGIS code | Excellent | Not needed: it runs the operations itself |
| Summarise a zoning ordinance PDF | Very good | Reads uploaded PDFs, and can turn their tables into data |
| Find the city's official parcel or zoning layer | Can suggest where to look | Searches 600+ registered open data portals and national catalogs, probes coverage, downloads it |
| Count features inside a boundary | Estimates from memory unless you supply data and code | Spatial join on the actual geometry |
| Measure areas and distances | Unreliable without a GIS engine | Computed in a projected coordinate system by GIS libraries |
| Same answer on a rerun | Not guaranteed | Deterministic operations: same data, same result |
| Show where each number came from | Only if you ask, and links can be wrong | Every layer keeps its publisher, dataset and link |
| Hand over GIS files | Only what its sandbox can write | Layers download as Shapefile or CSV |
How an AI GIS tool closes the gap
The fix is not a smarter chatbot. It is a different division of labour: the language model plans, the GIS engine calculates. In NeuraCities, a team of agents splits the work:
- 1An orchestrator reads the question and declares a checklist of what a complete answer needs, before fetching anything, so a misreading is visible in seconds.
- 2A Data Agent searches a registry of over 600 open data portals plus catalogs such as data.gov and open.canada.ca, the US Census, FEMA, USGS and OpenStreetMap, and probes each candidate for coverage and fields before downloading it.
- 3A GIS agent chooses from a library of deterministic operations (buffers, overlays, spatial joins, dissolves, network service areas, raster and terrain tools) running on GeoPandas, Shapely, rasterio, OSMnx, scikit-learn and PySheds.
- 4Cartography and chart agents style the result, and the answer is checked against the original checklist. Anything that could not be delivered is stated rather than hidden.
Because every number is the output of a GIS operation on a real layer, it can be checked: open the layer, read its table, follow its source link. The full walkthrough is in How NeuraCities turns a plain-English question into a real GIS analysis.
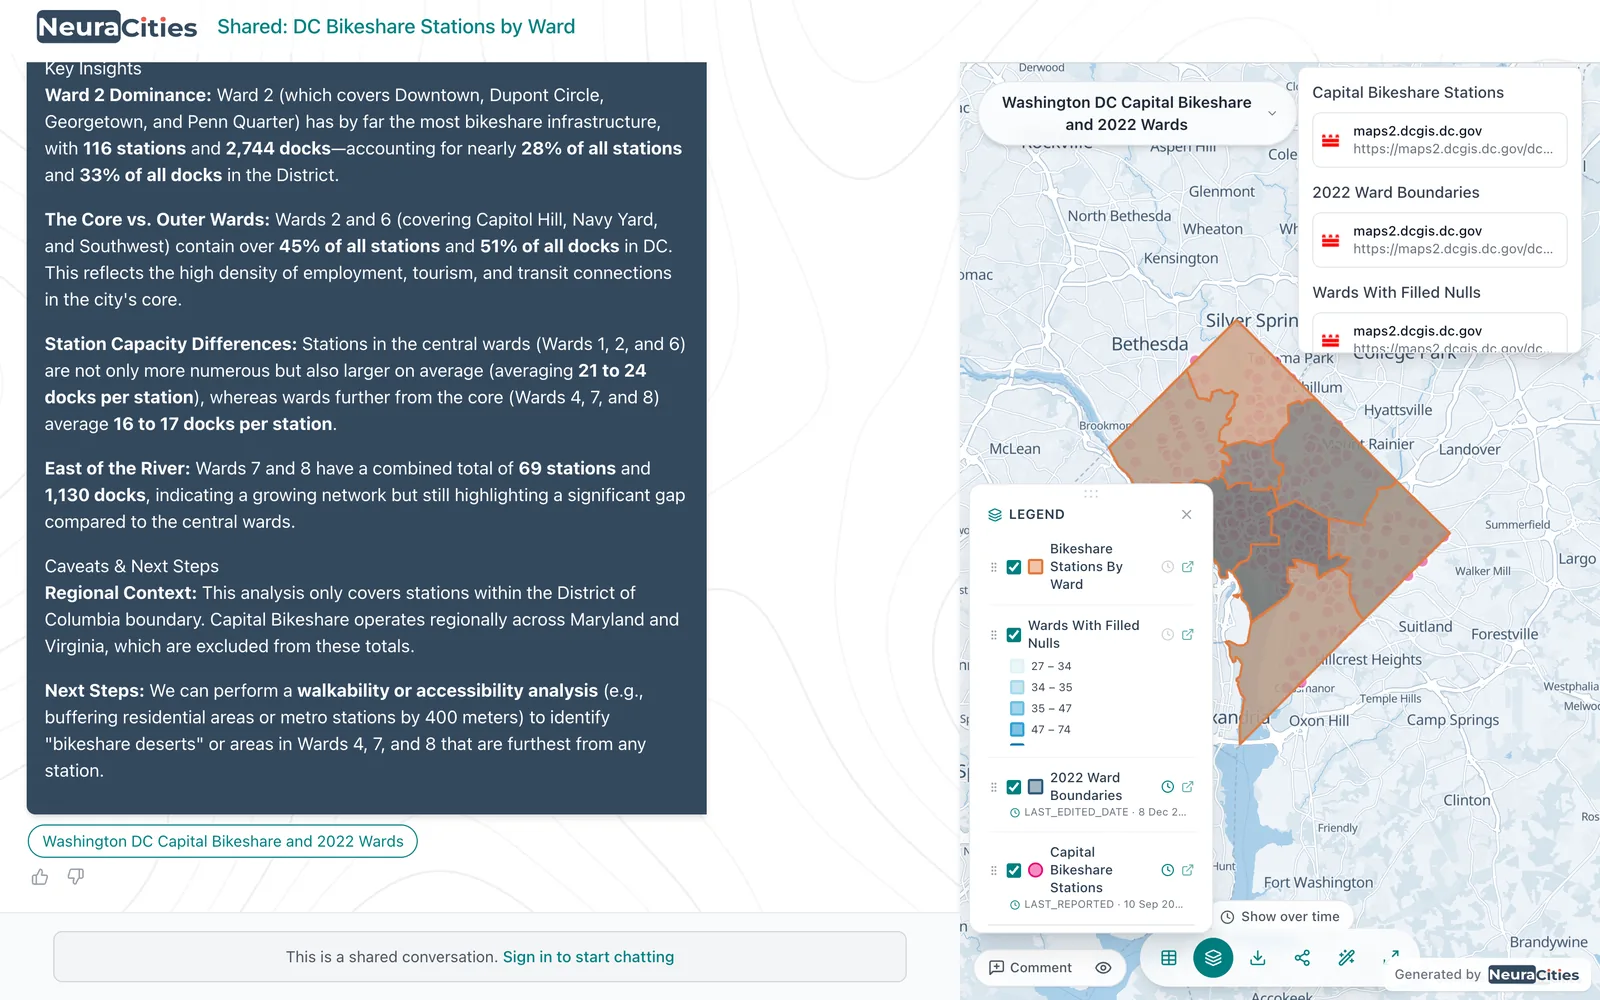
A worked example: Moab's flood damage
Here is a question no chatbot can answer from memory, because the answer lives in two specific layers:
Moab, Utah flooded in August 2022. Grand County published a layer of the properties that reported flood damage (Grand County Flooding Property Damage). Were those properties inside FEMA's mapped 100-year floodplain?
NeuraCities loaded the county's 122 damage reports and FEMA's flood hazard polygons, kept the Special Flood Hazard Area zones, and tagged every report as inside or outside with a spatial join. 105 of the 122 reports were outside the mapped 100-year floodplain. That number is a count of real points against real polygons, and anyone can rerun it and get the same result. The full story is in Moab flooded. Most of the damage was outside the flood map.
A chatbot could still help here: explaining what the SFHA_TF field means, or writing the GeoPandas code to do the same join on your laptop. What it cannot do on its own is supply the two layers and the count.
Using a chatbot and an AI GIS tool together
The tools are complementary, and many analysts will use both:
- Learn and plan with a chatbot. Ask it to explain an unfamiliar method or critique your proposed steps.
- Run the analysis where the data is. Ask the spatial question in an AI GIS tool, check the checklist, then check the layers and their sources.
- Finish in your desktop GIS if you need to. Download the result layers as Shapefile or CSV and open them in ArcGIS or QGIS, where chatbot-written scripts can take over for custom cartography or automation.
- Summarise documents with either. Ordinance and plan PDFs can go to a chatbot or be uploaded alongside your map layers.
For a wider survey of the options, from desktop GIS with AI assistants to agentic platforms, see AI GIS software in 2026: how to choose.
How to check any AI-generated map or number
Whatever tool produced it, these questions separate an analysis from a guess:
- Can you open the data? If there is no layer behind the map, there is nothing to verify.
- Does each layer name its source? Publisher, dataset and date, not just "public data".
- Do the feature counts match the source? If a city publishes 2,722 bus stops, the loaded layer should have about that many, not 200.
- Do the parts add up? Counts by district should sum to the total; areas by zone should not exceed the study area.
- Does a rerun match? The same question on the same data should give the same number.
- Were distances measured in a projected system? Buffers in degrees are a classic silent error.
Frequently asked questions
Can ChatGPT do GIS analysis?
Partly. ChatGPT explains GIS concepts well and writes good Python, ArcPy, PyQGIS and SQL code. By default it does not have authoritative GIS layers, so counts, areas and coordinates it gives from memory can be plausible but wrong. For analysis, either run its code in your own GIS or use a tool that fetches real data and runs real GIS operations.
Can ChatGPT make a map?
It can write code that makes a map from data you provide, or generate an image that looks like a map. An image has no underlying features, attribute table or source, so it cannot be checked or reused as GIS data. An AI GIS tool returns map layers you can inspect and download.
Can ChatGPT read shapefiles?
Sometimes. A shapefile is several files (.shp, .dbf, .shx and .prj) that must stay together, and whether a chatbot can open them depends on the libraries in its code sandbox. NeuraCities accepts shapefiles, GeoJSON, File Geodatabases, CSV, Excel and GeoTIFF directly as map layers.
Is ChatGPT accurate for coordinates and geographic facts?
Not reliably. Research testing GPT-4o and Gemini on geocoding and elevation found their geographic accuracy inconsistent. Use a geocoder or an authoritative layer for anything that needs to be right.
What is the difference between ChatGPT and an AI GIS tool?
A chatbot answers from text. An AI GIS tool such as NeuraCities uses the language model to plan, while agents fetch real layers from official sources and a GIS engine computes buffers, joins, overlays and counts. Every layer keeps its source, and the same question on the same data returns the same result.
What is the best AI for maps?
It depends on the job. For learning GIS and writing scripts, a general chatbot is excellent. For answering spatial questions with real public data, maps, tables and sources, use an AI-native GIS platform built around deterministic geoprocessing.
Get a map, a table and the sources behind every number, built from real layers.
Ask a real spatial question