
How to prompt AI for GIS: example prompts for maps and spatial analysis
When an AI runs a GIS analysis, every phrase in your prompt becomes a decision: which layer, which source, which distance, which boundary to count inside. A vague prompt does not fail loudly. It quietly picks a default, and the map looks just as convincing either way.
This guide collects the habits that make spatial prompts reliable, with before and after examples, real questions from published case studies, and a template you can copy. The advice applies to any AI GIS tool; the examples come from NeuraCities.
Why prompting matters more in GIS than in chat
In ordinary chat, a loose question gets a loose answer and you can tell. In GIS, a loose question gets a precise-looking number. "How many parks are near schools in Austin?" has at least four hidden choices: which Austin, whose park layer, what "near" means, and whether a park near three schools counts once or three times. Each one changes the number, and none of them shows up on the map.
A good spatial prompt reads like a brief to a colleague who is competent but new to your city. It names the place, the data, the thresholds, the operation and the output. NeuraCities also states its interpretation as a checklist before fetching anything, which is your first chance to catch a misreading. Prompts that already answer those questions produce checklists you can approve in a glance.
A prompt template you can copy
Most good GIS prompts fill in the same seven slots. You will not always need all of them, but going through the list catches most ambiguity:
| Slot | What to write | Example |
|---|---|---|
| Place | City or county plus state or province | Nashville / Davidson County, TN |
| Data and source | The layers, and who should publish them | CATS bus stops and council districts from the city's open data portal |
| Criteria | Filters with explicit distances and thresholds | Vacant, over 10 acres, within half a mile of an interstate |
| Measure | Count, area, length, distance or score | Count of stops; area in square miles |
| Group by | The boundary layer to summarise in | Council districts, not census tracts |
| Integrity | Dissolve, one row per feature, totals | Dissolve the buffers first; include the citywide total |
| Output | Map styling, table columns, chart | Color districts by count; table of district, count, total |
Put together, it reads like this:
In [city, state], using [layer] and [layer] from [official source], find [features] that are [within X m of / outside / inside] [layer]. Measure the [count / area] of [features] in each [boundary layer], with one row per [feature] and the overall total. Show the [boundaries] colored by that value, a table of [columns], and a chart of the top [N].
Name the place, and name the source
Place names repeat. There are Portlands in Oregon and Maine, Springfields in many states and a London in Ontario. Adding the state or province costs two characters and removes the most basic ambiguity.
The source matters just as much. A city's own open data portal, OpenStreetMap and a federal dataset can all have a layer called "parks" or "bus stops", with different coverage and different definitions. If you know which one is authoritative for your work, say so:
| Before | After |
|---|---|
| Map the bus stops in Charlotte. | Map the CATS bus stops in Charlotte, NC from the city's open data portal. |
| Show parks in Phoenix. | Show the public parks layer from the City of Phoenix open data portal, not OpenStreetMap. |
| Find substations near Houston. | Find electrical substations in Harris County, TX from HIFLD, and tell me if a utility or city layer exists instead. |
If you know the layer's name or its fields, include them. The Charlotte transit question that became Who waits for the bus in the rain in Charlotte? did exactly that:
Which Charlotte, NC city council districts have the most bus stops with no shelter? Fetch the CATS bus stops (they have Shelter and Bench fields) and the city council district boundaries. Keep the stops where Shelter is empty or No, count them inside each council district, color the districts by that count, and show a table of the districts with their counts of unsheltered stops and total stops.
The same goes for a layer you already know exists: the Moab question named Grand County's layer by its published title, "Grand County Flooding Property Damage". And if the authoritative layer is your own, upload it. Your files take priority over public data.
Turn adjectives into distances, thresholds and measures
Words like near, large, close, underserved and walkable are the most common source of silent defaults. Replace each with a number and a unit:
| Before | After |
|---|---|
| Big vacant parcels near the highway | Parcels whose land use contains VACANT, over 10 acres, within half a mile of an interstate |
| Areas that can't walk to a park | Areas more than 800 m (a 10-minute walk) from any public park |
| Low-income tracts far from groceries | Census tracts with median household income below the city median, more than 1 mile from a grocery store |
| Sites close to power | Parcels within 1,500 m of an electrical substation |
Then say what to measure. "How much of Phoenix is beyond a 10-minute walk from a park" is an area question; "how many tracts" or "how many people" is a count. Both are reasonable, and they produce different maps. The Phoenix run in Where Phoenix can't walk to a park reported an area, 367 square miles beyond the walk, while the Denver grocery question reported a count, 28 tracts.
A looser question is fine when you are exploring. Asked "Where in Dallas could a large-scale data center go: parcels big enough, zoned for it, and close to an existing power plant?", the run behind A data center shortlist by Thursday settled on parcels over five acres, industrial or commercial zoning and within five kilometres of a power facility. Those are sensible defaults. If your client means 20 acres and substations, though, say 20 acres and substations.
Prevent double counting: dissolve buffers, one row per feature
Two of the most common errors in any GIS, manual or AI, come from overlaps. Both are easy to prevent in the prompt.
Dissolve overlapping buffers before measuring area
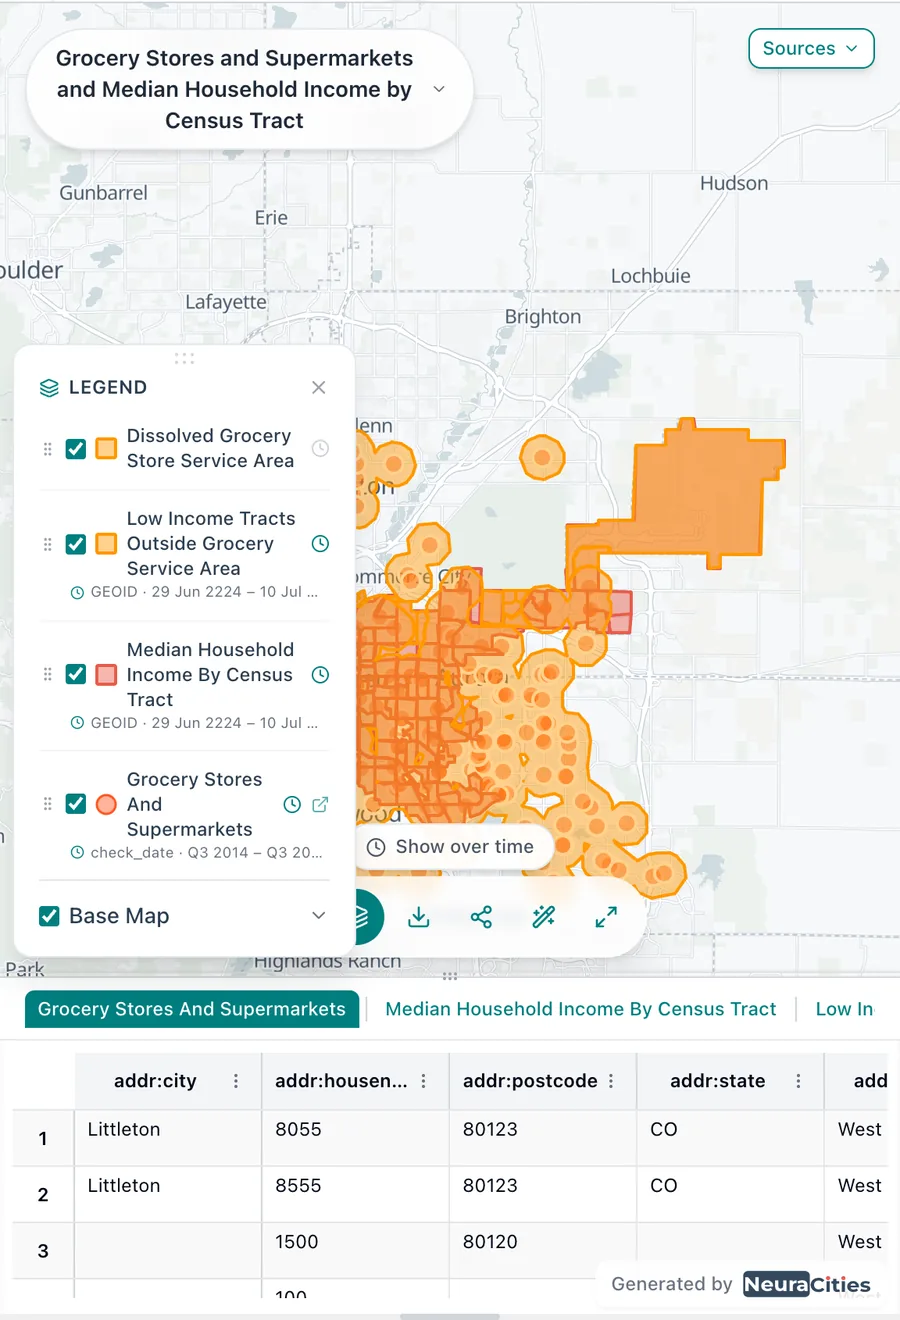
Buffer 220 grocery stores by a mile and many of the circles overlap. Add up their areas and the same land is counted several times, so the "area served" can exceed the city. Ask for the buffers to be merged first: "buffer every store by 1 mile and dissolve the buffers into one service area before comparing it with the tracts." That is the step the Denver analysis in Which parts of Denver are a mile from groceries? used.
Ask for one row per feature when joining
A spatial join attaches every match. A parcel that touches two zoning districts becomes two rows, and a count of parcels quietly goes up. The Nashville screen in Seven parcels in Nashville, if you want to stay dry said so explicitly:
Each parcel must appear exactly once in the result (do not duplicate parcels that touch several zoning districts).
The same applies to any one-to-many relationship: stops near several routes, buildings across two flood zones, tracts that cross a city line. Tell the AI which feature is the unit and that it should appear once.
Say which boundary to group by
"By neighborhood" can mean official neighborhood boundaries, planning areas, council districts, ZIP codes or census tracts, and each tells a different story. Name the layer that matches the decision:
- For a council briefing, use council districts: that is what each member represents.
- For a township or county board in a rural area, ask for townships, not census tracts, so the summary lines up with the jurisdictions that will act on it.
- For grant eligibility, use the geography the grant defines, often census tracts.
- Phoenix is divided into planning villages. The Phoenix question asked for neighborhoods, and the answer split the gaps across the city's 15 planning villages. Naming the layer up front removes the guess.
Census ACS data usually comes by tract or block group. If you need it summarised by a different boundary, ask for an area-weighted join so values are apportioned rather than assigned whole.
Ask for the total, and check that the parts add up
The fastest sanity check in GIS is arithmetic. Ask for the overall total next to the breakdown, then add up the parts:
- Charlotte: the seven council district counts of unsheltered stops (687, 461, 440, 347, 239, 152 and 110) add up to 2,436, which matches the total of 2,436 unsheltered out of 2,722 stops.
- Moab: 105 damage reports outside the floodplain plus 17 inside gives 122, the number of reports Grand County published.
- Nebraska: the towns in each distance band to the nearest fast charger sum to 529, every incorporated place in the state layer.
If the parts exceed the total, something was counted twice. If they fall short, something fell outside every boundary, or a filter removed more than you meant.
Check each layer's feature count against the source
Before trusting a result, open each input layer's table and compare its size with what the publisher says it holds. Charlotte's portal publishes 2,722 CATS stops; Nashville's parcel layer has 286,920 parcels. A layer that loaded a few hundred features when the source has thousands was probably truncated or clipped too tightly, and every number downstream inherits the gap.
Ask the question with a decision behind it
"Where are the fast chargers in Nebraska?" is a lookup; a charging app already answers it. "Which Nebraska towns are farthest from a public DC fast charger?" is a decision question: it tells the AI what to measure, what to rank and who the answer is for. That is the question behind The Nebraska towns more than 50 miles from a fast charger.
| Lookup | Decision question |
|---|---|
| Where are the bus stops in Charlotte? | Which council districts have the most stops with no shelter? |
| Show me Charlotte's Opportunity Zones. | Which Opportunity Zone census tracts in Charlotte, NC are actually near transit? |
| Where is the floodplain in Moab? | Were the properties that reported flood damage inside FEMA's mapped 100-year floodplain? |
| Map grocery stores in Denver. | Which parts of Denver, CO are low-income and more than a mile from a grocery store? |
Decision questions also produce better deliverables: a ranked table, a chart and a sentence someone can act on, as in Which of Charlotte's Opportunity Zones actually have transit? and Where does Miami flood first?.
Follow up in the same conversation, then save it as a workflow
Do not start over to refine a result. Each follow-up builds on the layers already loaded, so it is faster and keeps the earlier steps on record. Good follow-ups are one sentence:
- "Drop anything within 300 m of a school."
- "Now do the same against the 500-year flood zone."
- "Measure driving distance instead of straight-line miles."
- "Only count stations with four or more plugs."
- "Add the total population of each district from the Census."
When a prompt works and you will need it again, for the next city, the next month or a different threshold, save it as a workflow and replace the parts that change with variables:
Which {{city}} council districts have the most bus stops with no shelter? Use the transit agency's stop layer from the city's open data portal, count unsheltered stops and total stops inside each district, and include the citywide total.
Running the workflow turns each {{variable}} into an input field, with a location picker for places, and the steps stay the same every time so results are comparable. More on saving and sharing workflows in Your data and your team in NeuraCities.
Frequently asked questions
How do I write a good AI prompt for GIS?
Name the place with its state or province, the layers and the official source you want, explicit distances and thresholds, whether you want a count or an area, the boundary to group by, and the outputs (map, table, chart). Ask for one row per feature and an overall total so you can check the result.
What are good AI prompts for urban planners?
Questions with a decision behind them work best, for example: "Which council districts have the most bus stops with no shelter?", "Which census tracts are low-income and more than a mile from a grocery store?" or "Which areas are more than an 800 m walk from any public park, by planning village?"
Why does an AI map give me a different number than I expected?
Usually because the prompt left a choice open: a different source layer, a different definition of near, overlapping buffers counted twice, or a join that duplicated features. Check each layer's source and feature count, ask for the total, and confirm the parts add up.
How do I avoid double counting in a buffer analysis?
Ask for the buffers to be dissolved into a single area before measuring or overlaying it, and ask for one row per feature when joining, so a parcel touching two zones appears once.
Should I start a new chat for each change?
No. Follow up in the same conversation so the loaded layers and earlier steps carry over. When you will run the same question again for another place or threshold, save it as a workflow with {{variables}}.
Can I use the same prompts in ChatGPT?
The habits help in any AI tool, but a general chatbot does not fetch GIS layers or run geoprocessing by default, so specific counts and areas still need real data and a GIS engine. See our explainer on whether ChatGPT can do GIS.
Paste the template, fill in your city and get a sourced map, table and chart.
Try a well-written GIS prompt