
How to do a street tree inventory: what to collect, how to sample, and where to plant next
A street tree inventory is the basic record of an urban forest program: what trees you have, where they are, how big they are and what condition they are in. Without one, pruning cycles, risk work, budgets and diversity goals are all based on guesswork.
Inventories can also cost more than they need to, and go stale fast, when nobody first decides what they are for. This guide covers how to scope one, what to collect, when a sample is enough, what aerial data can and cannot replace, and how to turn the record into a list of where to plant next.
What an inventory is for
Write down the decisions the inventory has to support before you choose a method. Different goals need very different data:
| Goal | What you need | Approach |
|---|---|---|
| Annual work plans and pruning cycles | Each tree, with location and maintenance need | Complete inventory |
| Managing risk | Each tree of concern, assessed by a qualified person | Complete or targeted inventory |
| A budget case or benefits estimate | Species and size distribution | Sample may be enough |
| Checking species diversity | Species for a representative population | Sample or complete |
| Choosing where to plant | Existing trees, open sites and need | Inventory plus GIS analysis |
ISA's Best Management Practices for tree inventories make the same point: each attribute should relate directly to an objective. Every extra field adds time per tree, multiplied by every tree in the city.
Complete inventory or sample?
| Complete inventory | Sample inventory | |
|---|---|---|
| What it covers | Every tree in the defined area | All trees on randomly selected street segments |
| Answers | Which tree, where, and what to do about it | How many trees, which species, what size overall |
| Best for | Day-to-day management and work orders | Planning, budgets and first-time benefit estimates |
| Main drawback | Higher cost, and needs ongoing updates | Cannot tell you about any individual tree |
How big should a sample be?
Two published reference points are helpful. The i-Tree Streets sample inventory guidance says samples typically cover 3 to 6% of street segments, giving about a 10% standard error on the citywide tree count, depending on community size and how much segments vary. Virginia Tech's street tree assessment project randomly selects 5 to 15% of a locality's streets and counts all the trees on them.
Selecting segments at random matters more than the exact percentage. Choosing streets because they are easy to reach, or because they are known to be leafy, biases the result. Stratify by land use or neighborhood if your city varies a lot, since a single citywide estimate can hide exactly the gaps you care about.
Define the population before you start
Decide what counts as a street tree: public right of way only, or also parks and other public land? What about private trees overhanging the street? Is there a minimum size? And should you record empty planting sites? Most of these choices cannot be changed later without going back out, and vacant sites are especially valuable, as the planting section explains.
What to collect for each tree
Massachusetts' tree inventory fact sheet sets the minimum as location, species, size and condition, with risk rating, pests, maintenance needs and site conditions as useful additions. Virginia's field protocol records species, trunk diameter, condition, age class, planting type and land use. A sensible starting schema looks like this:
| Field | Priority | Why it matters |
|---|---|---|
| Location (coordinates and street address) | Core | Crews need to find the tree, and GIS needs to map it |
| Species | Core | Drives pest exposure, diversity and benefits |
| Trunk diameter (DBH) | Core | A standard proxy for size, age class and benefit |
| Condition | Core | Sets maintenance and removal priorities |
| Maintenance need | Common | Turns an inventory into a work plan |
| Site type and width | Common | Affects what can be planted back |
| Overhead lines and hardscape conflict | Common | Important for species choice and sidewalk repairs |
| Risk rating | Optional | Only useful when done by someone qualified, on a defined method |
| Pest or disease signs | Optional | Valuable for known threats such as ash in borer-affected areas |
| Vacant planting site | Recommended | A ready-made list for the planting program |
| Inspection date and inspector | Core | Tells you how current each record is |
If you plan to use benefit tools, check their input requirements before collecting. i-Tree Streets, for instance, required species, DBH and street segment ID for every tree. Species codes also matter: decide on one naming list up front, since fixing inconsistent species names later is tedious.
Risk ratings are not a side note
A condition rating is not a risk assessment. Under the ANSI A300 Part 9 and ISA framework, tree risk assessment has three levels: limited visual, basic and advanced. If your inventory records risk, state which level was used and who did it. Otherwise, a rating can imply more certainty than the survey delivered, and that can matter if a tree later fails.
Running the fieldwork
- 1Write a field guide with definitions and photos for each condition class, plus rules for edge cases such as multi-stem trees.
- 2Train and calibrate. Have crew members rate the same trees and compare their answers before they split up.
- 3Set up mobile collection with fixed pick lists, so species and condition are entered the same way each time.
- 4Start with a pilot of a few streets to test time per tree and find any problems with the schema.
- 5Audit a random subset by having a second person re-inspect some trees, especially for species and condition.
- 6Store the data in GIS or tree management software, with a clear owner and a defined update process.
Keeping it current
An inventory begins to age the day it is finished. The cheapest way to keep it current is to connect it to daily work: when a crew prunes, removes or plants a tree, the record updates. Virginia's assessment project, for example, accepted existing inventories only if they were relatively recent, within 5 to 10 years, and covered all streets. A staged cycle that reinspects a part of the city each year is also easier to fund than a single large resurvey.
Read the inventory for diversity risk
One of the first things to do with a finished inventory is check concentration. The usual benchmark is the 10-20-30 rule, attributed to Frank Santamour: no more than 10% of a tree population from one species, 20% from one genus and 30% from one family.
It is a floor, not a guarantee. Emerald ash borer shows why: a population within the genus limit could still lose a fifth of its trees. Santamour himself noted that the rule offers little protection against pests with a broad host range. Some programs set stricter limits, particularly for new planting. It also helps to check by neighborhood, since a citywide figure can hide a street where nearly every tree is the same species.
What aerial data and AI can and cannot do
Remote sensing and field inventories answer different questions. Knowing which is which keeps a project honest:
| Information | From imagery or LiDAR | From the field |
|---|---|---|
| Canopy cover | Yes, and it is the best way to measure it | Impractical across a city |
| Location of individual crowns | Yes, within the limits of the imagery | Yes, precisely |
| Public or private | Yes, by overlaying parcels and right of way | Yes, but slower |
| Height and crown size | Yes, with LiDAR | Yes |
| Species | Limited, and needs validation | Yes |
| Trunk diameter | Not measured directly | Yes |
| Condition and structural defects | Broad signals at best | Yes |
| Risk rating | No | Yes, by a qualified assessor |
Crown detection also has blind spots. Overlapping canopies can merge into one crown, and small young trees can be missed. So treat a detected tree count as a planning layer rather than a legal or work-order record, and verify it with field samples.
Remote sensing still earns its place: it gives a citywide picture in places that have no inventory, it helps target the fieldwork, and it can reveal gaps between neighborhoods before any crew goes out.
From inventory to where to plant next
An inventory says what you have. Planting priorities also need to know where trees can go and where they are needed most. That is a GIS question, and it takes three steps.
1. Find real planting sites
Vacant sites recorded in the field are the best source, because a person has seen them. Where you do not have those, you can derive candidates by removing existing trees, buildings, pavement, and utility conflicts, and spacing positions along the street. Field-check the shortlist either way, since buried services and other local conditions often differ from the data.
2. Measure need, block by block
A common pattern is to overlay canopy with heat and social vulnerability, so that planting reaches the people who have the least shade and the most exposure:
| Layer | Typical source | Why it matters |
|---|---|---|
| Canopy gap | Canopy layer compared with a local target | Shows where cover is lowest |
| Heat | Summer land surface temperature | Targets hot neighborhoods. Note that surface and air temperatures differ |
| Vulnerability | CDC Social Vulnerability Index in the US, or a local equity layer | Directs investment where people have the fewest resources to cope |
| Stormwater need | Impervious share, combined sewer catchments | Links planting to drainage goals and budgets |
American Forests' Tree Equity Score is a useful public reference. It scores neighborhoods from 0 to 100 by combining a canopy gap with a priority index of equally weighted climate, health and socioeconomic variables, and a lower score signals a higher priority. It is a good place to start, and a local analysis adds what a national score cannot: your actual planting sites, utilities and public land.
3. Publish how the ranking works
Weighting is a policy choice, not just a technical one. Decide the weights with the people affected, publish them, and show why each area made the list. An equity-led plan also has to budget for what happens after planting. Establishment watering and upkeep are part of the cost of a tree, and one that dies in year two delivers none of its promised benefits.
Using an inventory in NeuraCities Urban Forestry
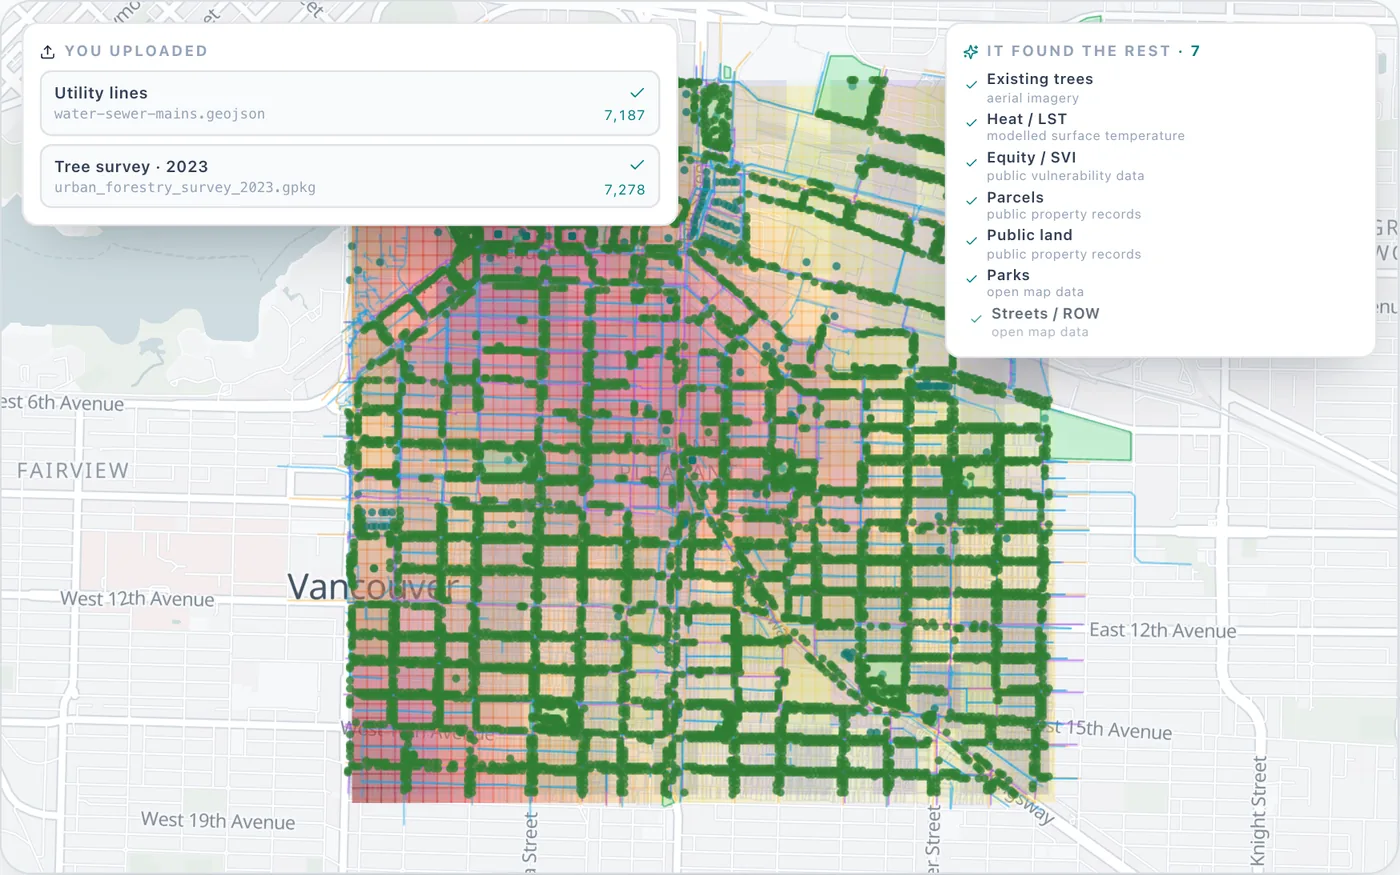
NeuraCities Urban Forestry does not replace a field inventory. It works alongside one, and gives you a citywide starting point if you do not have one yet. Pick a place, upload what you have, and it finds the other layers.
- Your inventory comes first. There is a typed upload slot for an existing tree inventory, and planting sites are carved around those trees. You can also upload utility lines, parcels and public land, and these take the place of public equivalents.
- No inventory? Crowns are detected from imagery. A tree detection model locates crowns in 1 m aerial imagery, so new sites stay clear of them. This gives you a location layer, not a species, DBH or condition record.
- Public and private are separated. Trees are split by ownership, and the analysis can keep to public land and street verges.
- Candidate street tree positions are placed along each street, spaced by road class, from about 12 m on major roads down to 8 m on pedestrian streets. Sites are kept clear of buried pipes and existing trees.
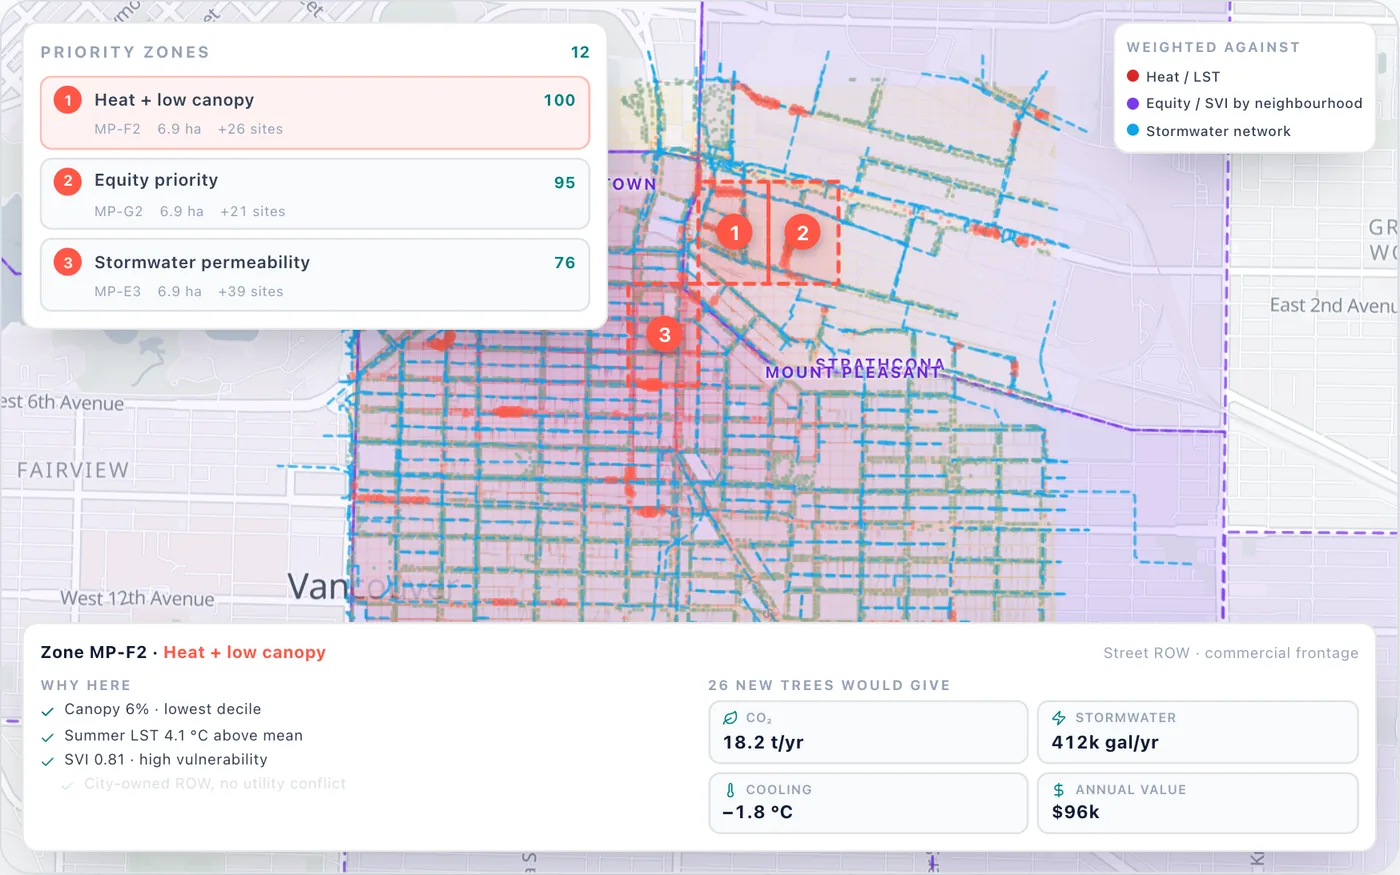
- Zones are ranked by heat, equity and canopy gap, and each has a stated primary driver, such as heat plus low canopy, equity priority, or stormwater permeability.
- Each zone is costed: estimated trees, cooling, dollar value and grant-eligible share, with 20 years of costs and benefits.
The product figures are 30 minutes from a boundary to a plan, and 25x cheaper than a traditional study. For validation, the canopy baseline measured 31.1% across Portland, Oregon, against a commonly cited 29.8%. These are model-derived, planning-level estimates, so confirm them with local field data. For the full canopy method, see how to build an urban tree canopy plan.
Every account's first analysis, up to 20 square miles, is free.
Frequently asked questions
What is a street tree inventory?
A record of the trees along a community's streets, usually including location, species, size and condition. It supports maintenance planning, risk management, budgeting, diversity goals and planting decisions.
What data should a tree inventory include?
At a minimum, location, species, size and condition. Common additions are maintenance needs, risk rating, pests, site conditions and vacant planting sites. Each field should relate directly to an objective, because every extra field adds time per tree.
What is the difference between a complete and a sample tree inventory?
A complete inventory records every tree and supports day-to-day management. A sample inventory records all trees on randomly selected street segments and estimates the whole population, which suits planning and budgets but cannot tell you about individual trees.
How many streets do you need for a sample tree inventory?
i-Tree's guidance says samples typically cover 3 to 6% of street segments, giving about a 10% standard error on the citywide tree count. Virginia Tech's assessment project samples 5 to 15% of streets. Random selection matters as much as the percentage.
Can AI or satellite imagery replace a tree inventory?
Not entirely. Imagery and LiDAR are excellent for measuring canopy and locating crowns across a whole city. Species, trunk diameter, condition and risk still need field inspection, so the two work best together.
How often should a tree inventory be updated?
There is no single rule. Keep records updated as crews prune, remove and plant, and consider reinspecting part of the city each year. Virginia's assessment project accepted existing inventories only if they were within about 5 to 10 years old.
How do you decide where to plant street trees first?
Combine real planting sites with measures of need, such as canopy gap, surface heat and social vulnerability, then rank areas and publish the weights. NeuraCities Urban Forestry ranks zones by heat, equity and canopy gap and shows the main reason each zone is on the list.
Can I upload my tree inventory to NeuraCities?
Yes. Urban Forestry has a typed upload slot for an existing tree inventory. Planting sites are then kept clear of those trees, and you can also add utility lines, parcels and public land.
Bring a boundary and whatever data you have, and get a canopy baseline and ranked planting zones.
Start with your trees