
How to do an existing conditions analysis for a comprehensive plan (even without GIS staff)
Every comprehensive plan rests on an existing conditions report: the chapter, or the whole separate volume, that describes the community as it is today before the plan says where it should go. It is where the land use map, the population trend, the housing numbers and the floodplain map live, and it is the part of the plan that takes the most mapping.
Large cities have GIS staff for this. Most small towns, villages and rural counties do not. This guide covers what an existing conditions report is for, the chapters it usually has, the maps and figures each one needs, where the public data comes from, and how to produce them in NeuraCities by asking one chapter at a time.
What an existing conditions report is for
A comprehensive plan (a general plan or master plan in some states) sets a community's long-range direction on land use, housing, transportation, infrastructure and the environment. The existing conditions report is the baseline. It answers "where are we now?" with maps, tables and trends, so that the plan's recommendations can point back to evidence rather than opinion.
A typical example is the Town of Hancock, Wisconsin plan, prepared by the East Central Wisconsin Regional Planning Commission in 2009. It comes in two volumes: the plan itself (goals, objectives and recommendations) and a separate Existing Conditions Report of Census and other data that compares the town with its historical numbers, the county and the state. That second volume, in the plan's own words, is where readers find the evidence behind the recommendations.
Some states spell out what a plan must cover. Wisconsin's comprehensive planning law, s. 66.1001, requires nine elements: issues and opportunities, economic development, housing, transportation, utilities and community facilities, agricultural, natural and cultural resources, land use, intergovernmental cooperation, and implementation (source). Most of those elements need an existing conditions chapter before they can make recommendations, so check your own state's planning statute for the required list.
The usual chapters, and the maps and numbers each needs
Chapter names vary by state and by consultant, but the content is remarkably consistent. This is the working list most plans draw from:
| Chapter | Maps | Numbers and figures | Where the data usually comes from |
|---|---|---|---|
| Land use | Existing land use by parcel, zoning, vacant and underused land, public ownership | Acres by land use category, vacant acres, acres by zoning district | County parcels and assessor land use codes, local zoning map |
| Demographics | Population, age and income by tract or block group | Population trend, age structure, household size, income, poverty | Census decennial counts and ACS 5-year estimates, TIGER boundaries |
| Housing | Housing age, tenure, vacancy, cost burden by geography | Units by type, owner versus renter, median value and rent, share cost burdened | ACS 5-year estimates, assessor records |
| Economy | Employers and commercial areas, where residents work | Jobs by industry, commuting flows, labor force | ACS, Census OnTheMap (LEHD), local business lists |
| Transportation | Road network and functional class, traffic volumes, sidewalks, transit, crashes | Road miles by class, commute mode and time | State DOT road and traffic count data, OpenStreetMap, ACS commuting tables |
| Environment and hazards | Floodplains, wetlands, streams and lakes, steep slopes, prime farmland soils | Acres and parcels in the floodplain, acres of wetland, farmland by class | FEMA National Flood Hazard Layer, USGS hydrography, NWI wetlands, USGS elevation, USDA soils |
| Community facilities | Schools, parks, libraries, fire and EMS, with service areas | Residents within a walk or drive of each facility | Local records, OpenStreetMap, state education data |
| Utilities | Water and sewer service areas, broadband, power | Parcels served and unserved | Usually the town's own utility maps or engineer's files |
The last row matters. Water and sewer lines are rarely on a public portal for a small town. They tend to live in an engineer's CAD files or on paper, and they need to be brought in rather than found.
Where the public data comes from
- Census ACS 5-year estimates are the source for income, housing cost, tenure, commuting and most other demographic detail. The Census Bureau publishes 1-year estimates only for areas of 65,000 people or more, while the 5-year estimates are available for all areas, including small towns, tracts and block groups. For a town of a few thousand, 5-year is the only option.
- Census decennial counts give the official population and housing unit totals for trend tables (2000, 2010, 2020).
- TIGER/Line boundaries supply the municipal, county, tract and block group shapes. They carry no demographic data themselves; the Census tables are joined to them by geographic code.
- The FEMA National Flood Hazard Layer is FEMA's database of current effective flood hazard data. Its digital coverage reaches over 90% of the US population, which means some rural areas are not covered digitally and need other FEMA products.
- County parcels and assessor land use codes are the basis of the existing land use map. Assessor codes are recorded for tax assessment, which is close to, but not always the same as, how a property is actually used, so expect some cleanup.
- State DOT data is the usual source for road functional classification, traffic counts and crash records.
- USGS hydrography maps streams, rivers and lakes. Note that the USGS retired the National Hydrography Dataset on October 1, 2023; the data remains available but is no longer maintained, and the 3D Hydrography Program is its replacement.
- NWI wetlands from the US Fish and Wildlife Service can be downloaded by state or watershed from the Wetlands Mapper. The FWS is clear that NWI maps wetlands by a biological definition and does not define regulatory jurisdiction, so the map is a planning layer, not a wetland determination.
- USDA soil survey farmland classification separates prime farmland, farmland of statewide importance and other classes, which is what an agricultural resources chapter needs.
How small towns usually get it done
A village with a part-time clerk and a volunteer planning commission does not have a GIS analyst. In practice the report gets made one of three ways:
- A regional planning commission or council of governments. New Hampshire, for example, has nine regional planning commissions that help municipalities with master plans, zoning and GIS mapping. Their staff time is shared across many towns, so schedules can be long.
- A planning consultant. Faster and tailored, but the existing conditions work is often the largest single line in the scope, and the maps arrive as PDFs that are hard to update afterwards.
- In-house, by hand. A planner or clerk assembles Census tables in a spreadsheet and borrows maps from the county. It works, but the maps are usually whatever someone else already made, not the ones the plan needs.
All three paths share the same bottleneck: finding, cleaning and combining the layers. That is the part NeuraCities is built to take on, whether you are the town planner doing it yourself or a regional planner producing reports for a dozen towns.
Producing the maps and figures in NeuraCities, chapter by chapter
Treat each chapter as a short conversation. Ask for the specific maps and numbers the chapter needs, look at the checklist NeuraCities declares before it starts, and correct it if it read something differently than you meant.
Land use
Map existing land use for every parcel in the Village of [name], [county], [state] using the assessor land use codes, grouped into residential, commercial, industrial, agricultural, public and vacant. Give me a table of parcels and acres in each group.
Demographics and housing
For the census tracts and block groups that cover [town], chart median household income, the share of renters and the share of households spending more than 30% of income on housing, from the ACS 5-year estimates, and compare them with the county.
Census ACS estimates and TIGER boundaries are among the sources the Data Agent searches directly. For trend tables from the decennial census, download the table from data.census.gov and upload it as a CSV: tables without geometry can be joined to boundaries on a shared code.
Environment and hazards
Which parcels in [town] intersect the FEMA 100-year floodplain? Count them by land use group and show the total acres.
The flood map is a starting point, not the full story. When Moab, Utah flooded in August 2022, NeuraCities compared Grand County's layer of properties reporting flood damage with the FEMA floodplain: 105 of the 122 reports were outside the mapped 100-year floodplain. If your town has its own record of past flooding, a drainage complaint log or a list of insurance claims by address, it belongs in this chapter next to the FEMA map.
Community facilities
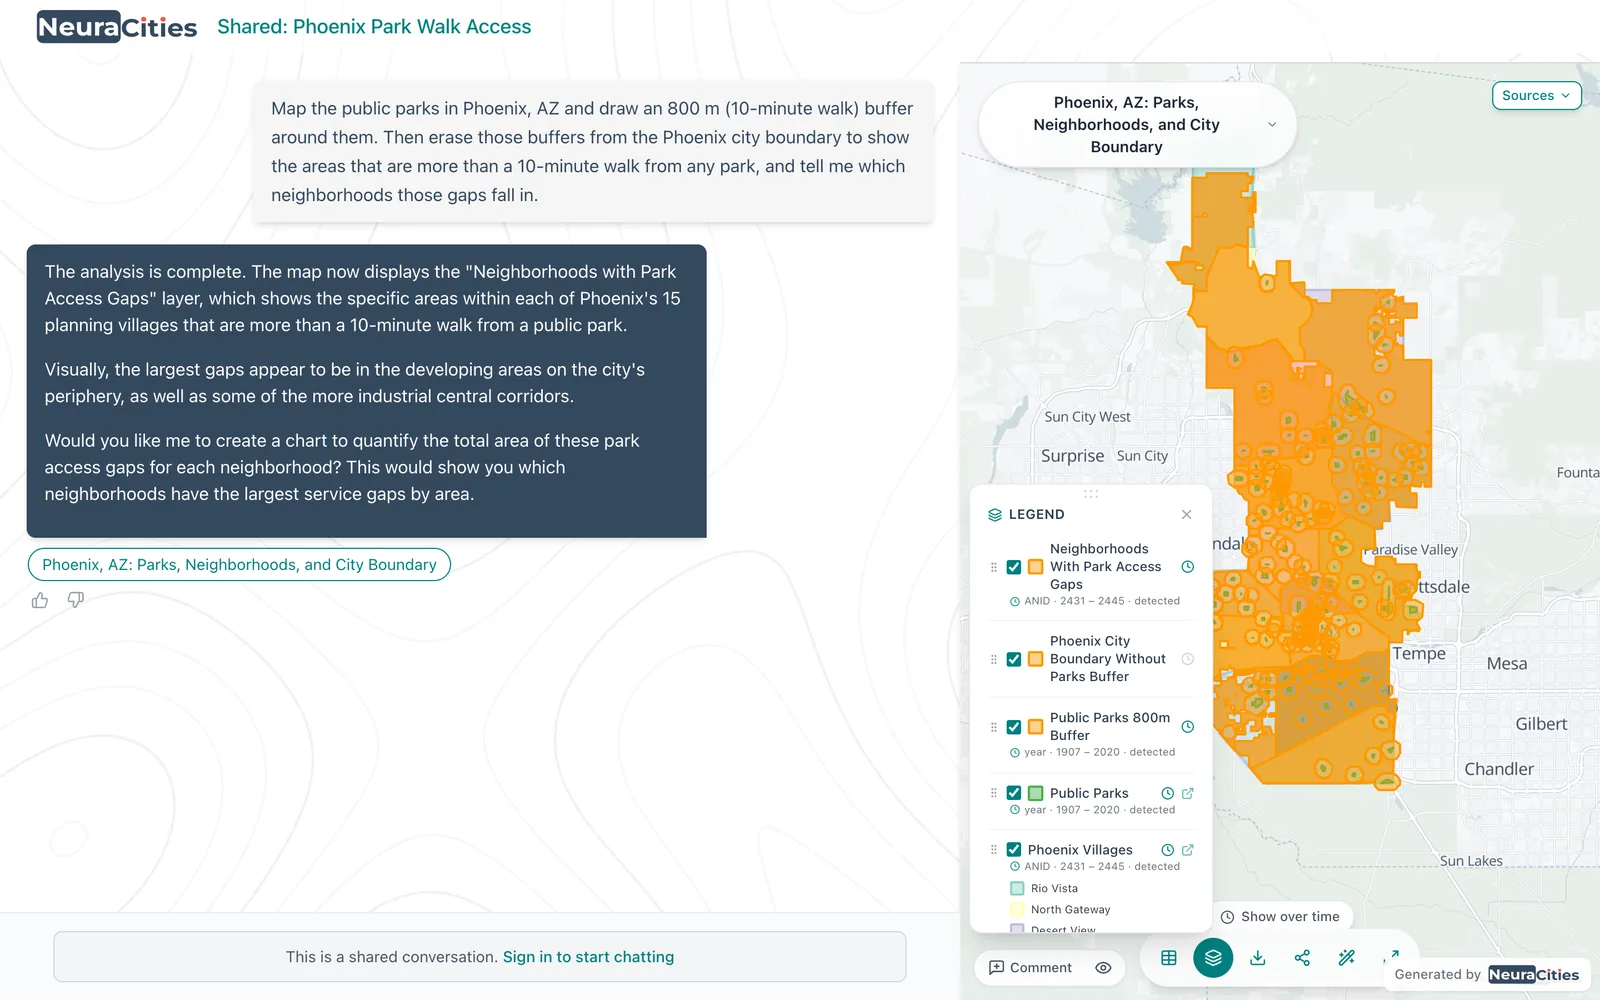
Draw a ten minute walk around every park in [town] and show which residential areas are outside it.
Transportation and utilities
Ask for the road network by functional class and the state DOT traffic counts. For water and sewer, upload what you have: a shapefile from the town engineer, a File Geodatabase, or even a PDF. Your own layers take priority over anything public, and every upload is kept in My Database for the next chapter.
Questions with a decision behind them
An existing conditions report is most useful when it is aimed at the choices the plan will have to make. These are the kinds of questions small-town planners bring, and what NeuraCities does with each:
| Question | The decision it informs | What the analysis does |
|---|---|---|
| "Which vacant or underused parcels within a quarter mile of Main Street could hold workforce housing, outside the floodplain?" | Where the plan's future land use map shows housing | Filters parcels by land use and size, buffers Main Street, removes floodplain parcels, returns a table and map |
| "Which parcels owned by the town, county or school district are larger than one acre and outside the floodplain and wetlands?" | Which public land could be offered for housing | Filters the assessor owner field, removes flood and wetland overlap, sums acres |
| "How many acres of prime farmland are inside our growth boundary, and on which parcels?" | Whether to redraw the growth boundary or phase it | Clips farmland soil classes to the boundary and joins them to parcels |
| "Which public parcels touch the river or sit within 300 feet of it?" | Where a riverfront trail or park could go | Buffers the river and selects publicly owned parcels inside it |
| "Which parcels are zoned for apartments today, how many acres is that, and how much of it is vacant?" | Whether the zoning matches the housing goals | Joins zoning to parcels and sums acres by district and vacancy |
Questions with several criteria, like the workforce housing one, follow the logic of a site screen: hard constraints remove parcels and preferences rank what is left. If you want to rank the remaining sites, give the weights in the question. The AI site selection guide walks through that in detail, and the Nashville vacant parcels case study shows a real screen that narrowed 286,920 parcels to seven.
Rural and county-scale questions
County and regional plans ask the same questions over a larger area, often about distance. NeuraCities measured how far each of Nebraska's 529 incorporated places is from a public DC fast charger and found 21 towns more than 50 miles away, with Cody the farthest at 70.8 miles. The same approach answers distance questions a county plan needs: towns farthest from a hospital, a grocery store or a high school.
Access questions work the same way. In Denver, NeuraCities buffered 220 grocery stores by a mile and found 28 below-median-income tracts outside that reach. A rural version swaps the mile for a drive, measured as a network service area on the street network.
From maps to the report
- Print-ready maps: the export canvas lays out pages with a map, legend, title and notes, in portrait or landscape, and exports PNG, JPG, SVG or PDF. On Pro, save your plan's standard page format and reuse it for every chapter.
- Charts and tables: charts export as PNG, PDF or CSV and tables as Excel, ready to drop into the report.
- A draft chapter: turn a conversation into a dashboard page with the maps and charts embedded and a sources section drawn from the data record, then edit the text in place.
- Steering committee review: share the conversation by link so committee members can open the live map, and leave comment pins on specific parcels.
- GIS files: download any layer as a Shapefile or CSV for the county GIS office or the consultant who takes over.
Plans get revised, and the existing conditions questions barely change between revisions. Save a chapter's question as a workflow with {{variables}} for the town name and the year, and the next update starts from the same analysis instead of from scratch. A regional planner can run the same workflow for every member town.
Frequently asked questions
What is an existing conditions analysis in a comprehensive plan?
It is the baseline section of a comprehensive plan that documents the community as it is today: land use, population, housing, economy, transportation, natural resources and hazards, community facilities and utilities. It provides the maps, tables and trends that the plan's goals and recommendations are based on.
What maps does a comprehensive plan need?
Usually an existing land use map, a zoning map, demographic maps by census tract or block group, a transportation map, environmental maps of floodplains, wetlands, water and soils, a community facilities map, utility service areas and a future land use map. Most of the source data is public.
Can a small town do a comprehensive plan without GIS?
Yes. Many small towns work through a regional planning commission or a consultant. With an AI GIS such as NeuraCities, a town planner can also produce the existing conditions maps and figures directly by asking for them in plain English, then check each layer's source before using it.
Where do I find data for an existing conditions report?
The Census Bureau's ACS 5-year estimates and decennial counts, TIGER boundaries, the FEMA National Flood Hazard Layer, county parcels and assessor records, state DOT road and traffic data, USGS hydrography, the National Wetlands Inventory and the USDA soil survey cover most chapters. Utility maps usually come from the town itself.
Should a small town use ACS 1-year or 5-year data?
5-year. The Census Bureau publishes ACS 1-year estimates only for areas with 65,000 or more people, so for small towns, tracts and block groups the 5-year estimates are the only ACS figures available.
Can I update the maps when the plan is revised?
Yes. In NeuraCities, save a chapter's question as a workflow with variables such as the town name, then rerun it at the next update. The steps stay the same, so the new maps are directly comparable with the old ones.
Ask for one chapter's maps and figures and see the sources behind each layer.
Start your existing conditions maps