
Where to find free GIS data for your city: parcels, zoning, flood zones and more
Almost every GIS project starts with the same search: "[my city] parcel data", "[my county] zoning shapefile", "flood zones GIS download". The data usually exists and is usually free. The hard part is knowing which agency publishes which layer, finding the portal it lives on, and noticing when the file you downloaded is quietly incomplete.
This guide is a reference for that search. It covers who publishes what in the United States and Canada, how to find a city's open data portal, which formats you will meet, how to check that a layer is complete and current, and the licensing details worth reading before you publish a map.
Who publishes what: the layer-by-layer cheat sheet
The most useful thing to know about local GIS data is that it is not published by one agency. Each layer has a natural owner, and searching for the owner is faster than searching for the layer.
| Layer | Usually published by | Where to look |
|---|---|---|
| Parcels (property boundaries, owner, value, land use) | County assessor, county GIS office, or a consolidated city-county | County GIS or open data portal; statewide parcel programs where they exist |
| Zoning | City planning department; the county for unincorporated land | City open data portal or the city's ArcGIS REST services |
| Flood zones | FEMA | National Flood Hazard Layer through the Map Service Center, the NFHL Viewer or FEMA's GIS web services |
| Boundaries (city limits, counties, tracts, block groups) | US Census Bureau | TIGER/Line Shapefiles |
| Demographics (population, income, housing, commuting) | US Census Bureau | American Community Survey estimates, joined to TIGER boundaries |
| Transit stops and routes | The transit agency | The agency's GTFS feed; many cities also publish stops on their portal |
| Roads, buildings, amenities | OpenStreetMap contributors | OpenStreetMap extracts or its APIs |
| Wetlands | US Fish and Wildlife Service | National Wetlands Inventory, by state or by HUC 8 watershed |
| Elevation | USGS | 3D Elevation Program through The National Map |
A few notes on the big ones
- Flood zones: FEMA's NFHL can be downloaded for a county or state as a shapefile, viewed and printed in the NFHL Viewer, or loaded as a web service. FEMA says the digital data covers over 90% of the U.S. population, so some places still rely on older paper maps. The "100-year floodplain" is FEMA's Special Flood Hazard Area, the zones whose codes start with A or V.
- Boundaries vs. demographics: TIGER/Line files carry geographic codes but, in the Census Bureau's words, the core files do not include demographic data. You join ACS tables to them by those codes.
- ACS 1-year vs. 5-year: 1-year estimates are only published for areas of 65,000 people or more. For tracts and other small geographies, use the 5-year estimates.
- Transit: a GTFS feed is a zip of text files defined by the GTFS Schedule reference: stops.txt holds stop locations, routes.txt and trips.txt describe service, and shapes.txt traces the route lines.
Statewide parcel programs, state clearinghouses and Canada
Before you hunt county by county, check whether the state has already done the assembly. A few examples that are worth knowing:
- North Carolina: NC OneMap's aggregated parcel dataset includes all 100 counties in North Carolina plus lands of the Eastern Band of Cherokee Indians, with ownership, acreage and assessed value.
- Wisconsin: the Statewide Parcel Map Initiative, a joint effort of the State Cartographer's Office and the Wisconsin Land Information Program, publishes about 3.56 million parcel records in its V12 release, as a statewide file geodatabase or as shapefiles and geodatabases by county.
- State GIS clearinghouses: most states run a GIS portal for statewide layers such as municipal boundaries, roads and imagery. In our Nebraska fast charger analysis, the 529 incorporated places came from Nebraska's state portal, gis.ne.gov.
Canada
In Canada the pattern is similar, with provinces playing the role that states and counties play in the US:
- Provincial parcel and land data: British Columbia's ParcelMap BC Parcel Fabric covers over two million parcels under the Open Government Licence (British Columbia), as a file geodatabase, KML or an ArcGIS REST service.
- Census boundaries: Statistics Canada publishes boundary files for census geographies such as dissemination areas, in two versions: digital files that include coastal water and cartographic files that cover only the mainland and coastal islands.
- Municipal portals: zoning, permits, trees and other city layers come from municipal open data portals, as in the US.
- National catalog: open.canada.ca lists federal datasets and many provincial ones, including ParcelMap BC.
How to find your city's open data portal
Search engines are good at this if you use the words portals actually use. Try these, in this order:
- 1"[city] open data" and "[county] GIS data". Most portals have one of these phrases in their title.
- 2"[county] GIS hub" or "[city] opendata.arcgis.com". Many local governments run their portal on ArcGIS Hub, and you can also search across Hub sites at hub.arcgis.com.
- 3"[county] parcels shapefile" or "[city] zoning shapefile" for a specific layer.
- 4"[county] arcgis rest services". Even when there is no polished portal, the server directory behind the county's web map often lists every published layer, each with its own query endpoint.
- 5The assessor's or planning department's own website. If none of the above works, these pages usually link to the GIS office, which is the right place to ask about layers that are not published openly.
You will mostly meet three kinds of portal: ArcGIS Hub sites (often on an opendata.arcgis.com address), Socrata sites (with a SODA API behind every dataset) and CKAN catalogs, the platform behind national catalogs such as data.gov and open.canada.ca. The data in all of them is the same kind of thing; only the download buttons and API differ.
The formats you will meet
| Format | What it is | Watch out for |
|---|---|---|
| Shapefile | The long-standing GIS exchange format: a .shp plus .dbf, .shx and .prj files, usually zipped | Keep all the parts together; the .prj holds the projection |
| GeoJSON | One text file, easy to use on the web | Large layers produce very large files |
| KML / KMZ | Google Earth format; FEMA offers a KMZ of the NFHL | Built for viewing; attributes can be less structured |
| File geodatabase | Esri's folder-based database (.gdb), common for large statewide downloads | Holds several layers; pick the right one |
| Feature service | A live ArcGIS REST endpoint you query instead of download | Record limits per request (see below) |
| CSV | A table, sometimes with latitude and longitude or address columns | May need geocoding or a join to boundaries |
| GTFS | A zip of transit text files | Stops are points in stops.txt; routes are lines only if shapes.txt exists |
How to check a layer is complete and current
This is the step most people skip, and it is the one that causes wrong answers. A download can open cleanly, look plausible on a map and still be missing most of its rows.
1. Get the real row count
- ArcGIS feature and map services: add returnCountOnly=true to the layer's query, for example .../MapServer/0/query?where=1=1&returnCountOnly=true&f=json. Per Esri's documentation, the response then contains only the count of features the query would return.
- Socrata: request the dataset's resource endpoint with **$select=count(*)**. Socrata's count function is meant for exactly this kind of $select aggregation.
2. Compare it with what you downloaded
Services cap each request. On Socrata, $limit defaults to 1,000 records per request. On ArcGIS, each layer has a maxRecordCount, and Esri's documentation describes paging past it with resultOffset and resultRecordCount until the response stops reporting exceededTransferLimit as true. A real example: the Mecklenburg County vacant land layer on Charlotte's GIS server returns at most 2,000 records per request, but a count query returns 27,742 parcels.
Numbers from the Mecklenburg County vacant land service. A tool that makes one request and stops would map 2,000 of the 27,742 parcels and never say so.
3. Check coverage and currency
- Coverage: does the layer actually cover your study area? A county layer may stop at city limits, and a city layer will not include unincorporated land.
- Last updated: look for an update date in the item details or metadata. Some sources say how often they refresh: the National Wetlands Inventory adds updates twice a year, in the October and May downloads.
- What the date means: a release date is not the same as the data date. Wisconsin's V12 parcels were collected from January to May 2026, with most tax roll records for 2025.
- Fields: open the attribute table and check that the field you need (land use, zoning code, owner) is filled in, not just present.
Licensing and disclaimers worth reading
Free to download is not the same as free of conditions. Check each dataset's license or terms page. A few that come up constantly:
- OpenStreetMap is under the Open Database License. You must credit OpenStreetMap and make clear the data is available under the ODbL, and if you alter or build upon the data you may distribute the result only under the same license.
- Canadian federal open data under the Open Government Licence (Canada) can be copied, modified and used commercially, as long as you include the provider's attribution statement. Provinces have their own versions, such as British Columbia's.
- Wetlands: the National Wetlands Inventory uses a biological definition of wetlands, and the US Fish and Wildlife Service says its data may not be consistent with wetland boundaries established under the federal regulatory definition. It is a screening layer, not a delineation.
- Parcels: parcel maps are a representation of property boundaries, not the legal record. ParcelMap BC, for example, states that the plan of survey or the registry information remains the authoritative source for legal boundaries.
How NeuraCities finds and loads this data for you
Everything above is what the NeuraCities Data Agent does when you ask a question about a place. Instead of you searching, it searches:
- A registry of 600+ open data portals (about 190 in the United States and 140 in Canada) across ArcGIS, CKAN, Socrata, OpenDataSoft and other platforms.
- Live catalog search of ArcGIS Hub and the Socrata Discovery API, plus national catalogs such as data.gov and open.canada.ca.
- Federal sources: Census ACS and TIGER boundaries, FEMA flood hazard data, USGS elevation, the National Land Cover Database, HIFLD infrastructure and more, plus OpenStreetMap.
Before downloading, the agent probes each candidate: how many features it has inside your study area, which fields it carries and whether the geometry makes sense. A county layer with zero features inside the city limits is caught there. When a question spans several jurisdictions, it can pull the same kind of layer from each and merge them.
| Real analysis | Layers it found | Published by |
|---|---|---|
| Seven dry parcels in Nashville | 286,920 parcels, 19,174 flood hazard polygons, 5,992 zoning districts | maps.nashville.gov; interstates from OpenStreetMap |
| Moab flood damage | 122 flood damage reports, 503 FEMA flood zone polygons | Grand County, UT; hazards.fema.gov |
| Charlotte bus stops in the rain | 2,722 bus stops with shelter and bench fields, 7 council districts | data.charlottenc.gov |
| Denver grocery access | 220 grocery stores, 178 census tracts with median income | OpenStreetMap; US Census ACS |
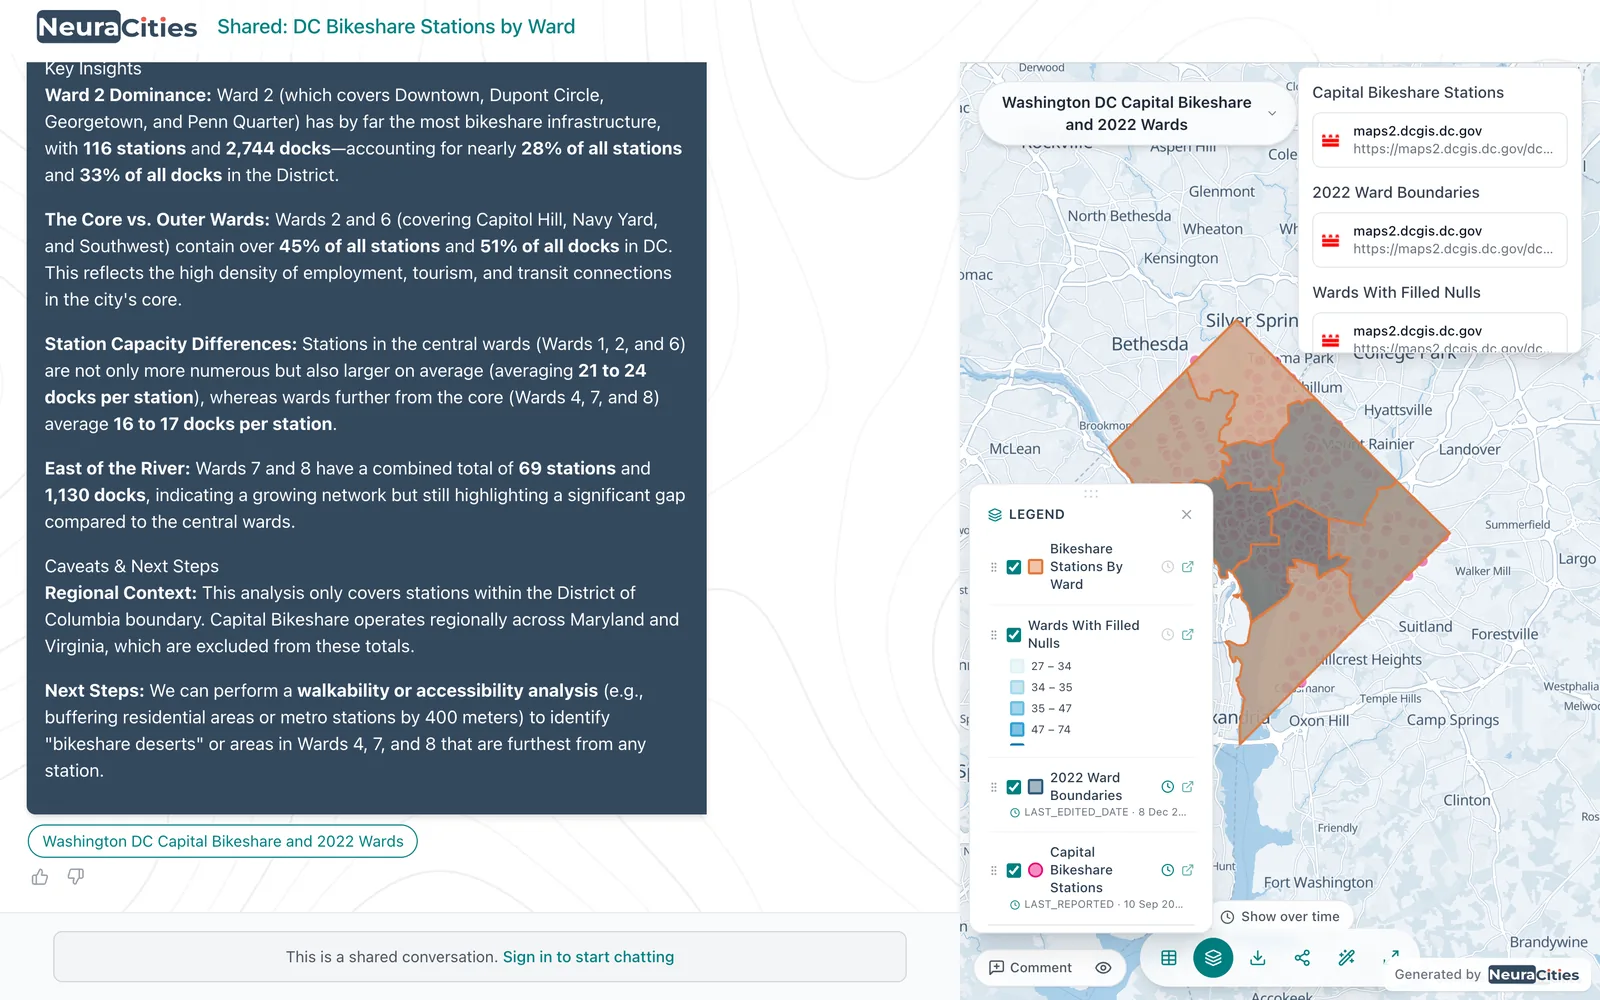
If the layer you need is not public, or you have a better version, upload it (Shapefile, GeoJSON, File Geodatabase, CSV or Excel) and the agents use yours instead. Uploads are saved to My Database for reuse, and any layer the agents load can be downloaded as a Shapefile or CSV for ArcGIS or QGIS.
Frequently asked questions
Where can I find GIS data for my city?
Start with the city's open data portal for zoning and city layers, the county GIS or assessor portal for parcels, FEMA's National Flood Hazard Layer for flood zones, Census TIGER/Line files for boundaries, the Census American Community Survey for demographics, the transit agency's GTFS feed for transit and OpenStreetMap for roads and amenities. Search for "[city] open data" or "[county] GIS data" to find the local portals.
Is parcel data free?
Often, yes. Many counties publish parcels on an open data portal, and some states assemble every county into one free download, such as North Carolina's NC OneMap parcels (all 100 counties) and Wisconsin's Statewide Parcel Map. Where a county does not publish parcels openly, ask its GIS office or assessor.
Where can I download a zoning shapefile?
From the city's planning department or open data portal, since zoning is set by the city (or by the county for unincorporated land). Search "[city] zoning shapefile" or "[city] zoning GIS". If there is no download button, check the city's ArcGIS REST services directory for a zoning layer you can query.
How do I download FEMA flood zones as a shapefile?
Use FEMA's Map Service Center to download the National Flood Hazard Layer for a county or state as a shapefile, or view it in the NFHL Viewer. The 100-year floodplain is the Special Flood Hazard Area, the flood zones whose codes start with A or V.
Why does my GIS download only have 1,000 or 2,000 records?
Because the service caps each request. Socrata returns 1,000 records by default, and each ArcGIS layer has a maxRecordCount (2,000 on the Mecklenburg County vacant land layer, for example). Check the true total with returnCountOnly=true on ArcGIS or $select=count(*) on Socrata, then page through the results.
What license is OpenStreetMap data under?
The Open Database License (ODbL). You must credit OpenStreetMap, make clear the data is under the ODbL, and share any altered or derived database under the same license.
More guides on site selection and land
Search for official and open datasets by city.
Find data for your city